Dashboard Core Positioning
The Dashboard serves as the platform’s global business overview portal. Through a “Data Visualization + Quick Operations” design, it enables rapid comprehension of core information including device status, alarm risks, and waybill progress, adapted to meet efficient team management requirements.
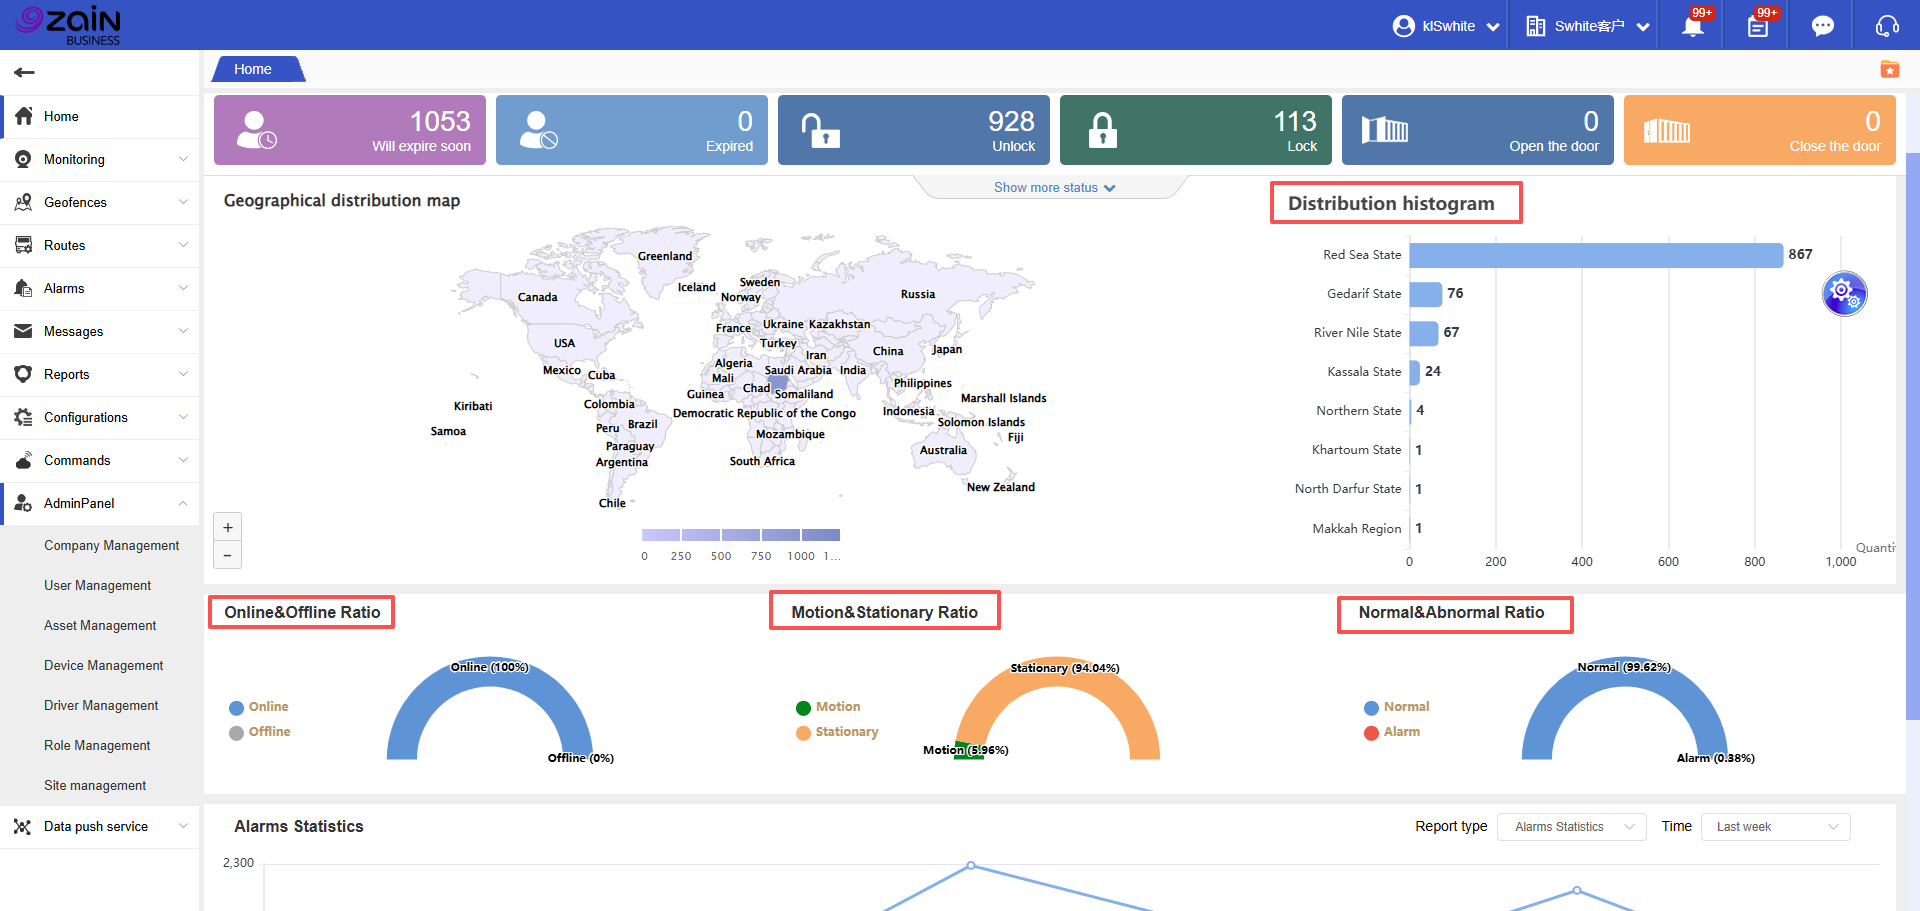
The system dashboard adopts a classic three-column layout of “Top Bar + Left Sidebar + Main Content Area,” balancing operational efficiency with information display needs, conforming to mainstream interface usage habits of international users:
Left: Collapsible menu bar (supports compact/full mode switching)
Top: Navigation control area (integrates account, information, and system tools)
Right: Core business information display area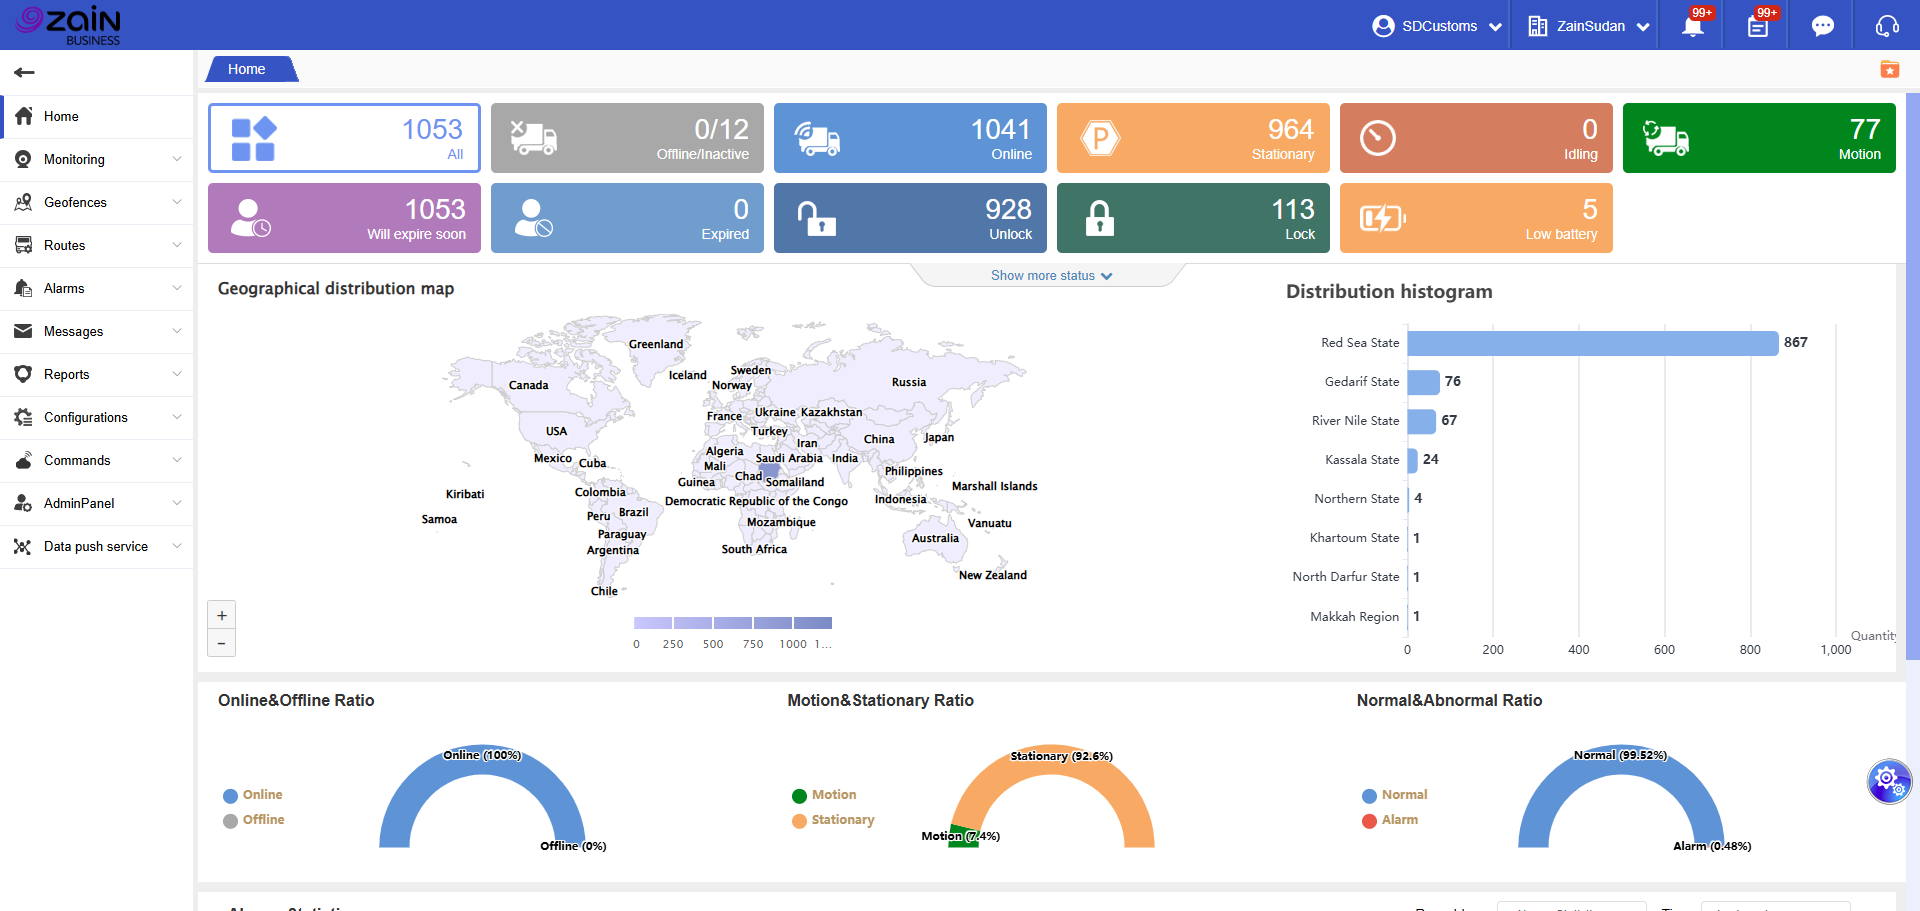
Top Navigation Bar: Core Control and Information Aggregation
Left Section: Brand and Customization
Displays the system logo and tagline to strengthen brand recognition. Supports custom enterprise logo and tagline to meet international enterprise brand display requirements.
Right Section: Account and Information Management
1. Account Management
Click “Current Login Account Name” for quick access to:
· Language switching: Supports multi-language interface switching
· Password modification
· System logout and other operations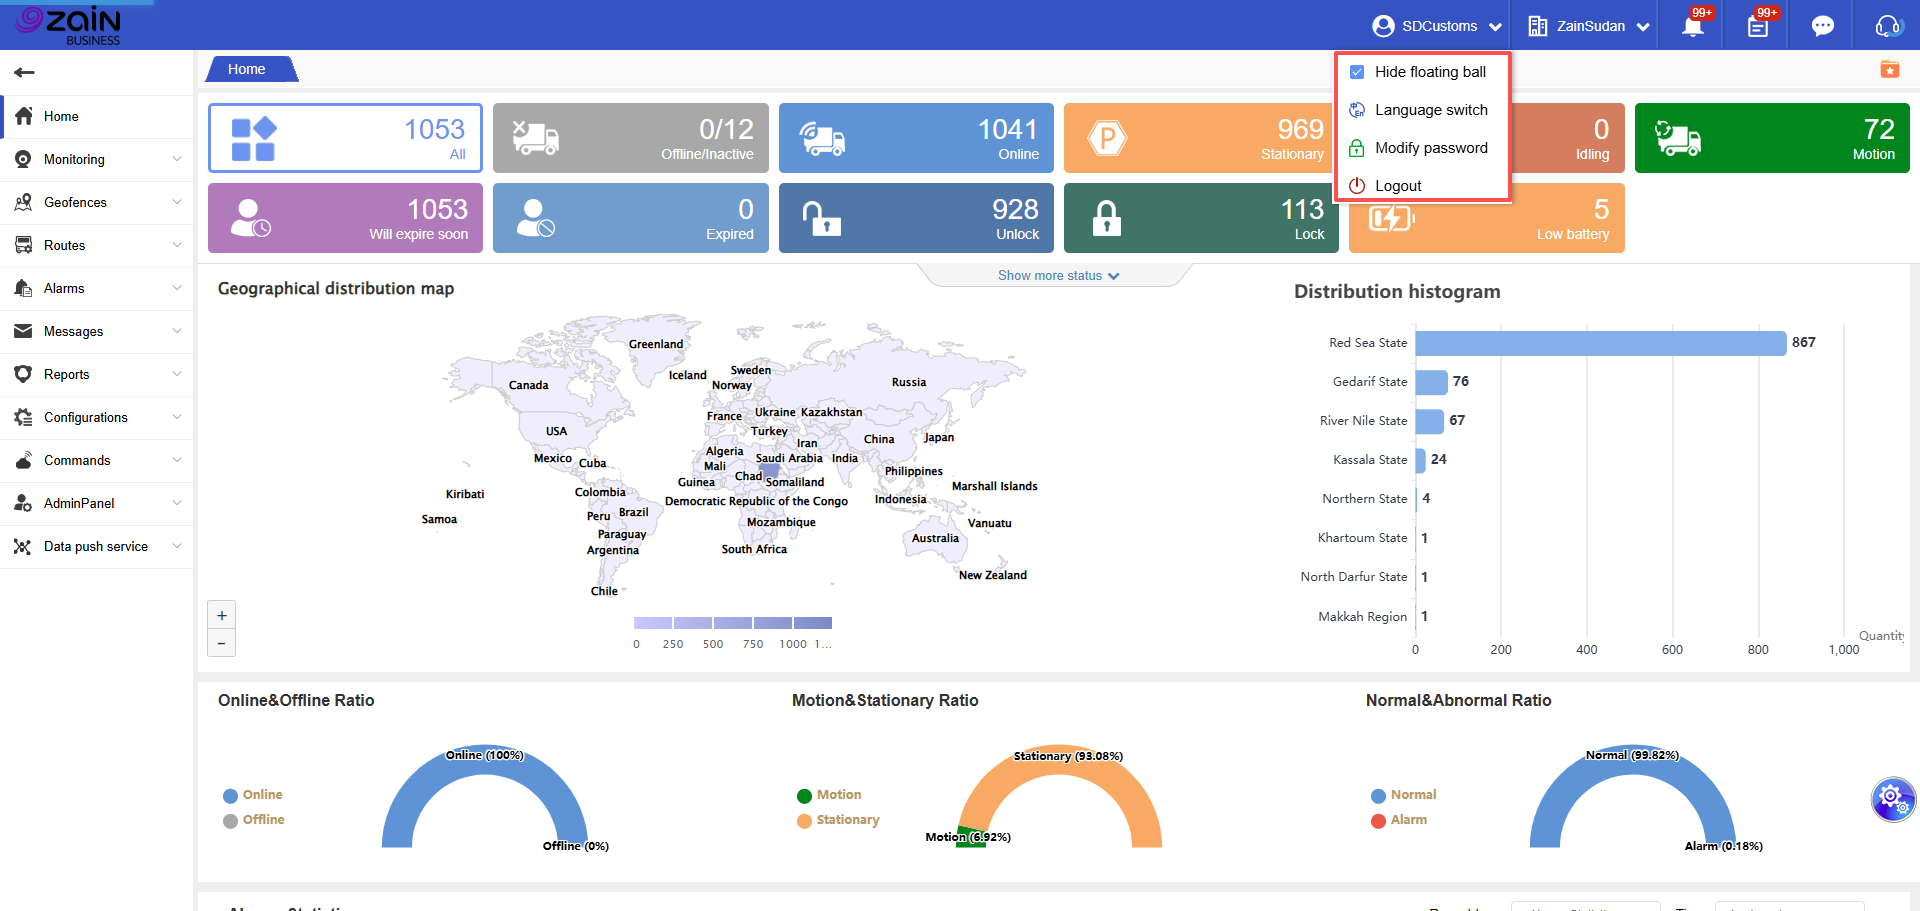
2. Operating Entity Confirmation
Company Information: Real-time display of the currently managed company name, preventing operational entity confusion during cross-border multi-company operations.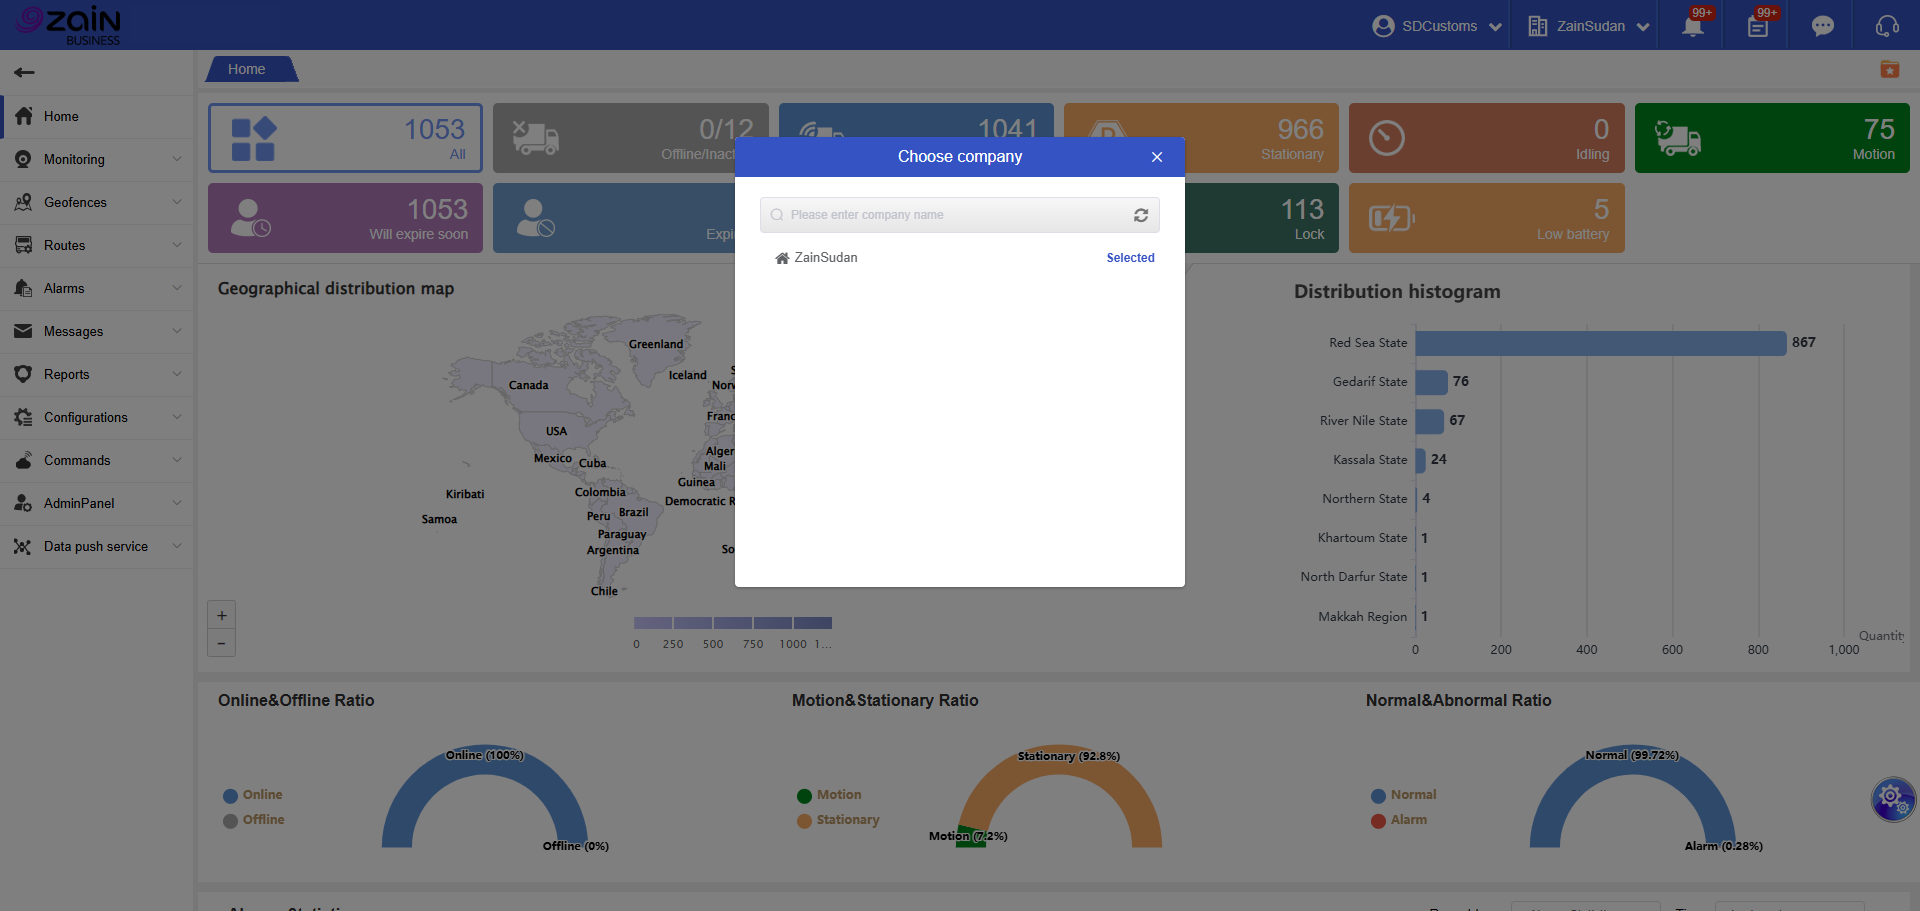
3. Information Center
Latest Alarms: Displays number of unprocessed alarms (example: 100+). Click to jump directly to details page. The system automatically distinguishes between “Standard Alarms” and “Active Safety Alarms” to help prioritize high-risk events.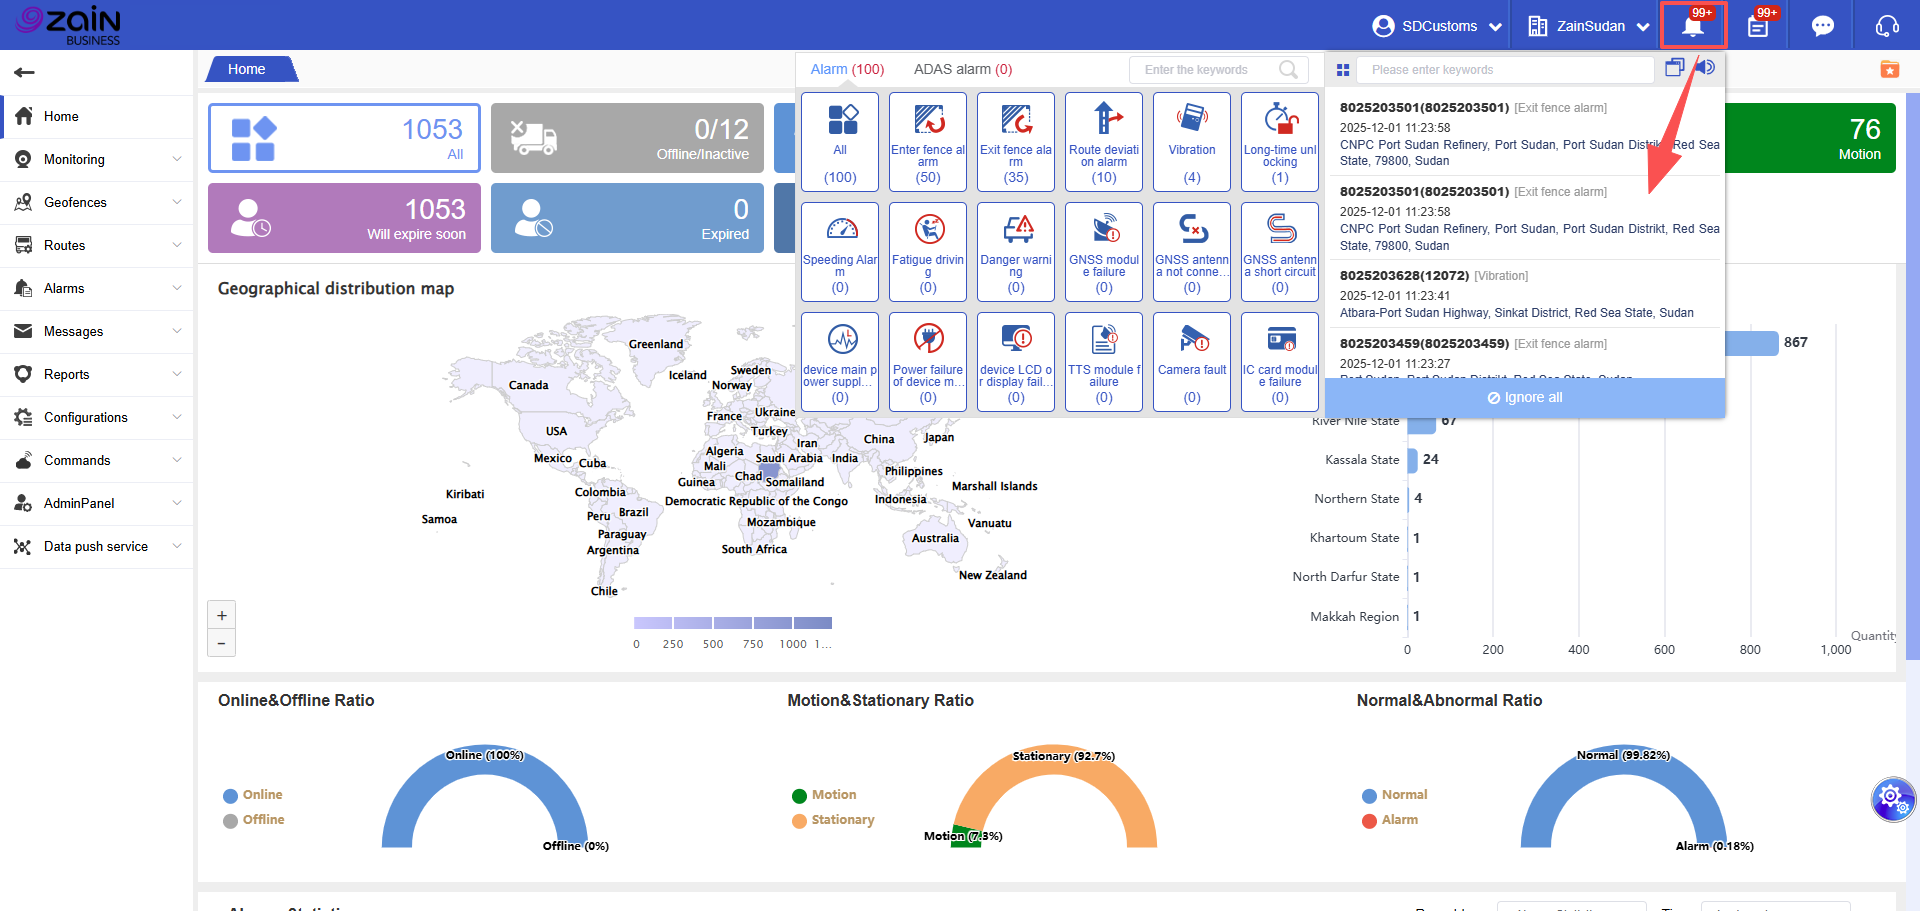
System Messages: Aggregates notifications such as account expiration and version updates, displaying up to 100 unread messages.
Event Notifications: Records device activities (such as lock/unlock operations, offline status), also supporting display of up to 100 unread messages.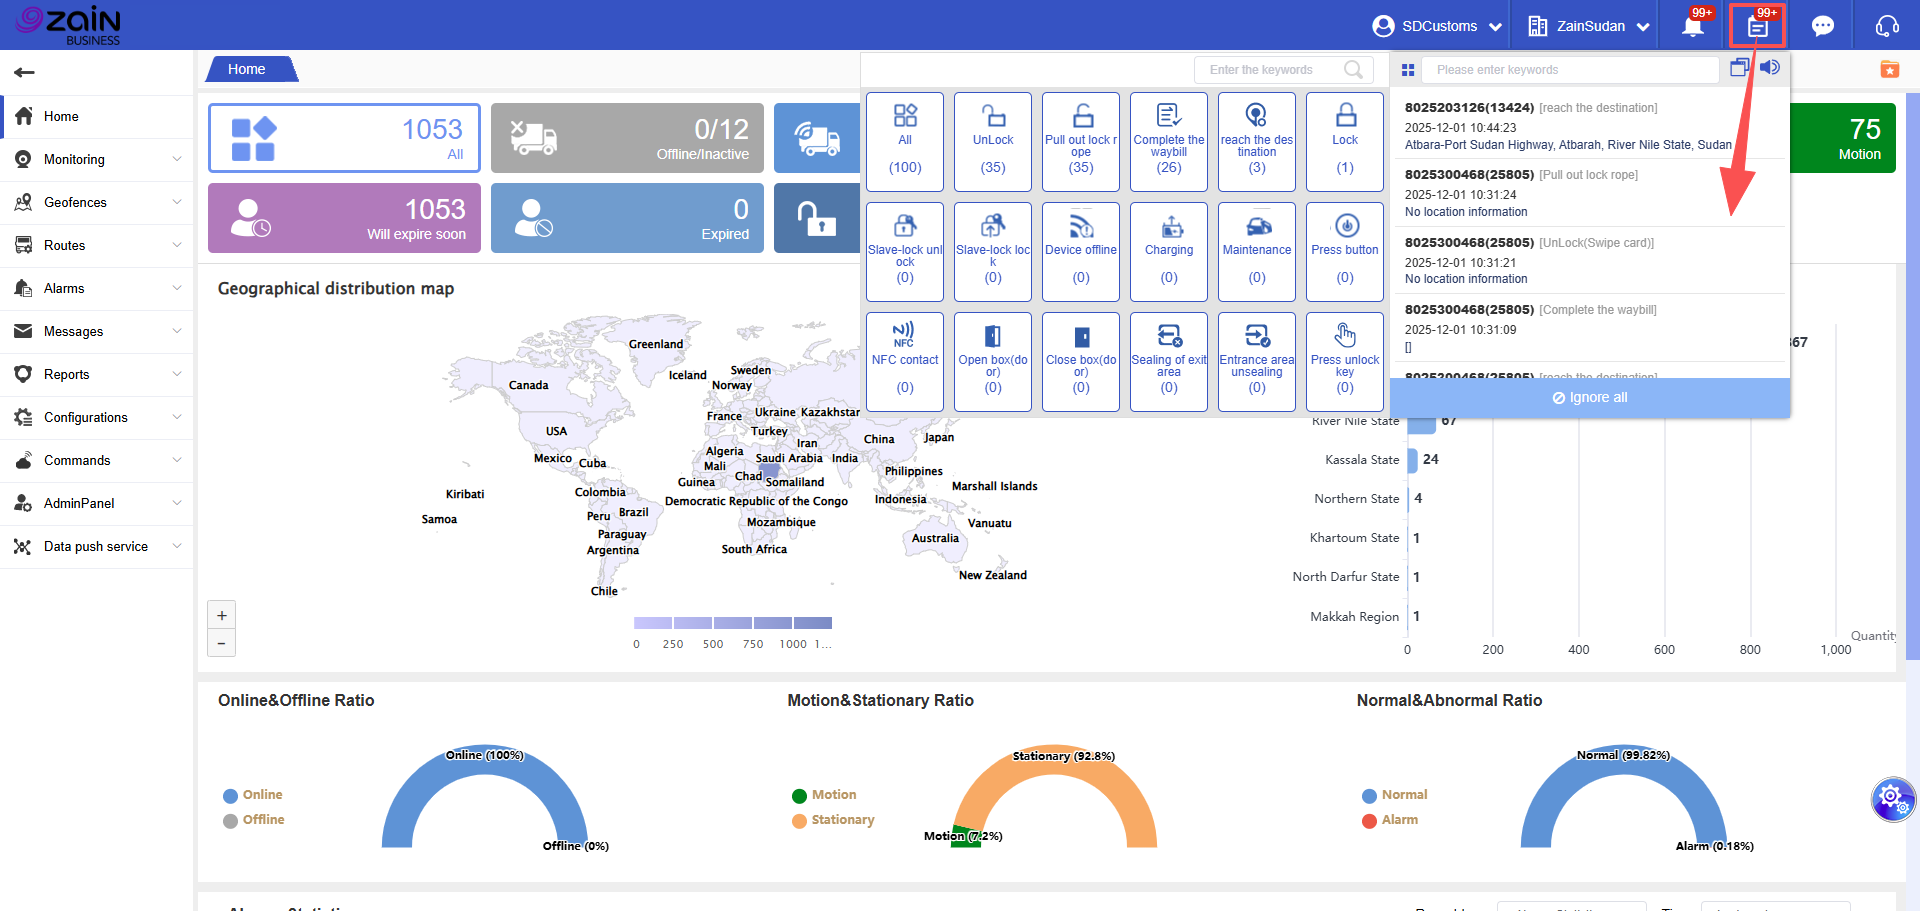
4. System Tools
System Update Log: Detailed recording of version iterations to help you stay informed about feature upgrade details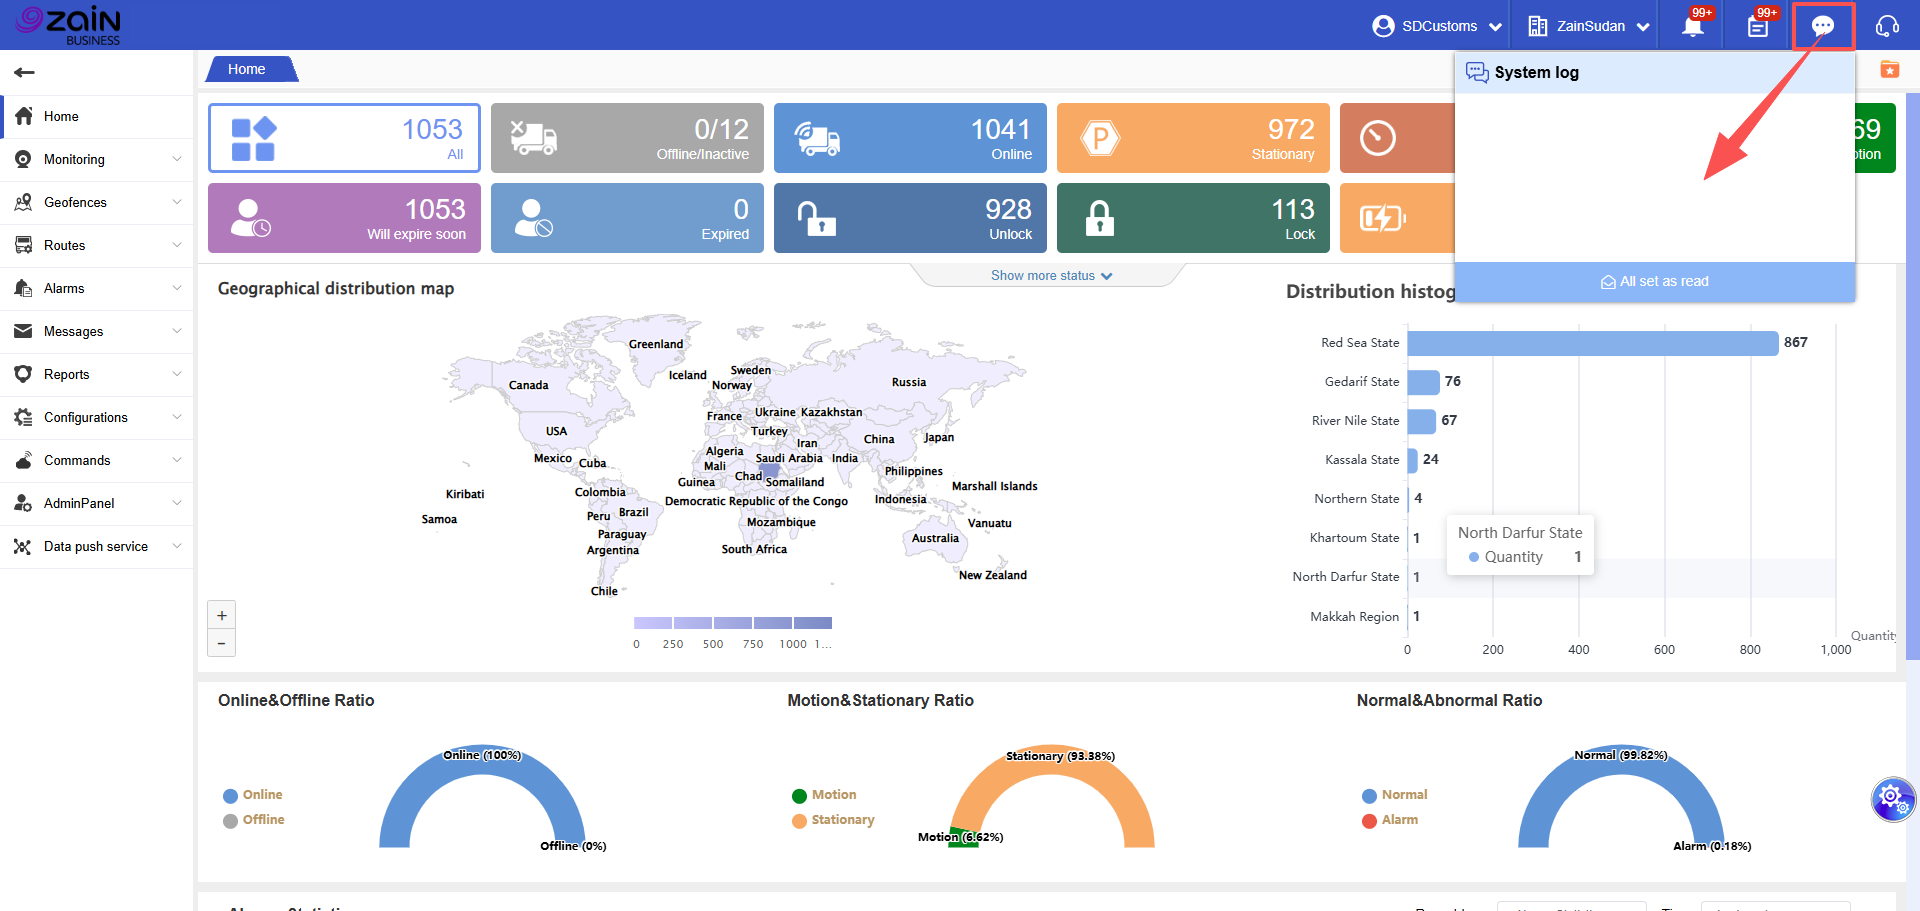
Dashboard Special Features: Adapted for International Collaboration and Personalization
Integrates operation manuals, FAQs, video tutorials, and mobile app download instructions for one-stop solution to usage questions. After switching to English interface, English version content is automatically displayed, adapted for cross-border team collaboration.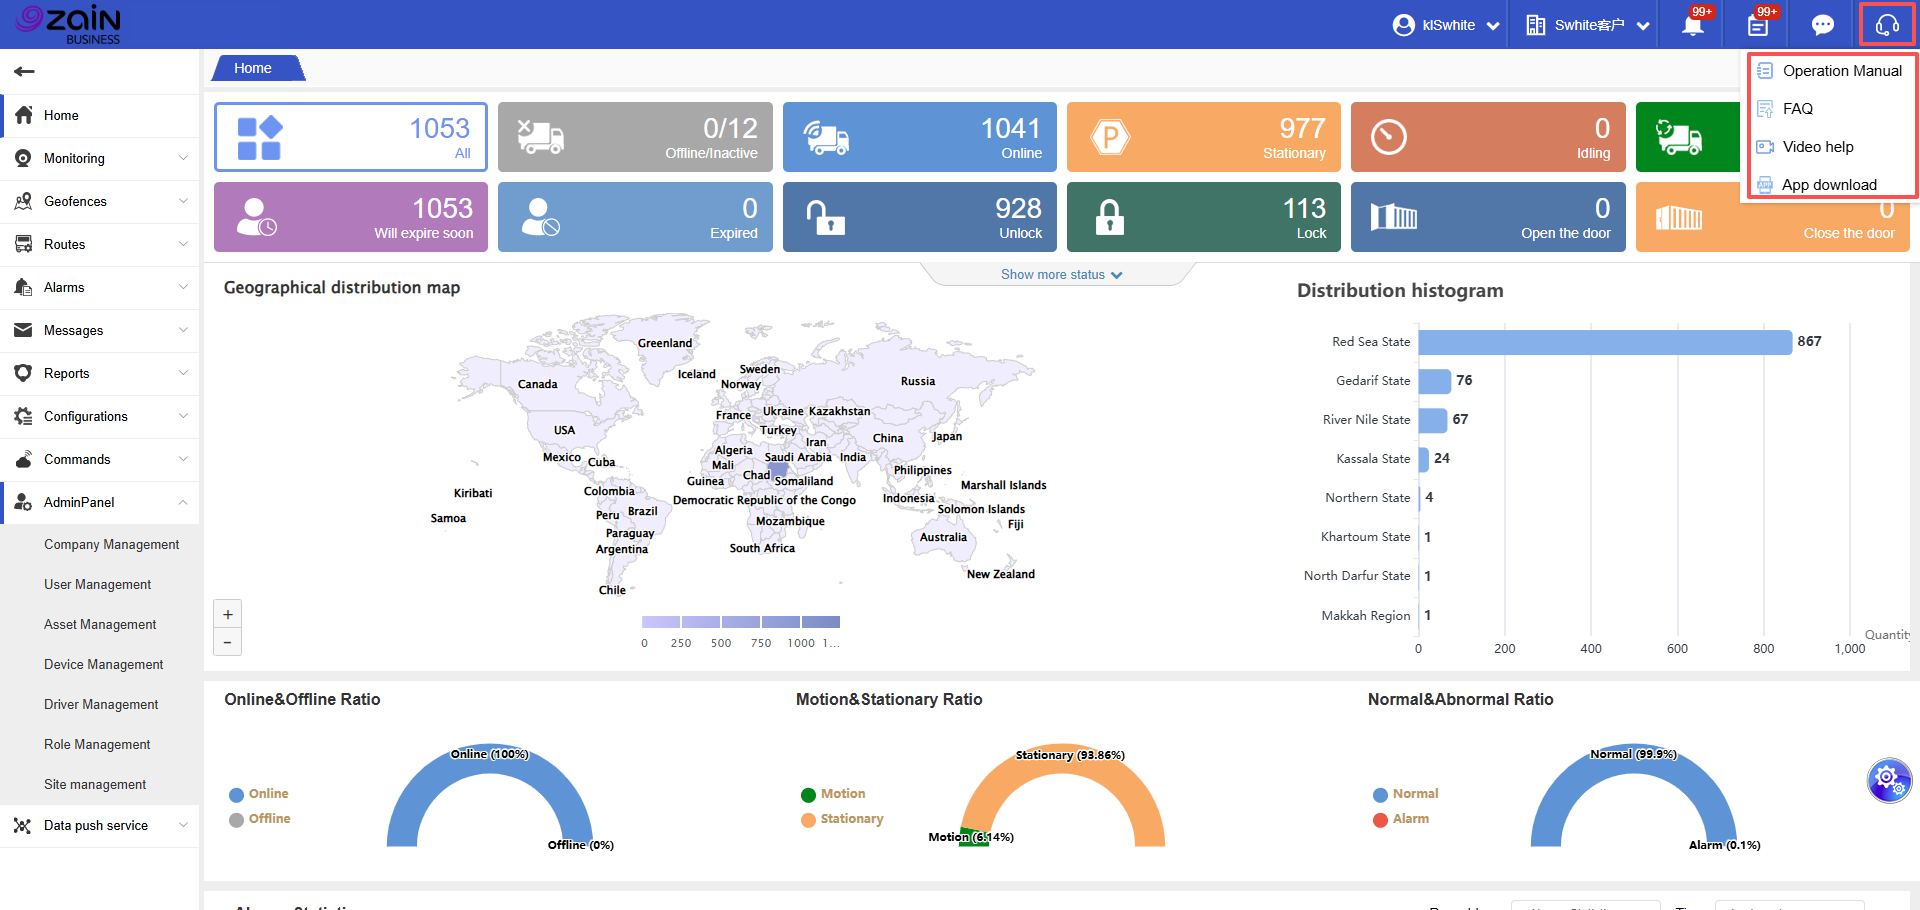
Click the “Floating ball” and use the right-click menu to customize and add high-frequency functions, significantly improving operational efficiency.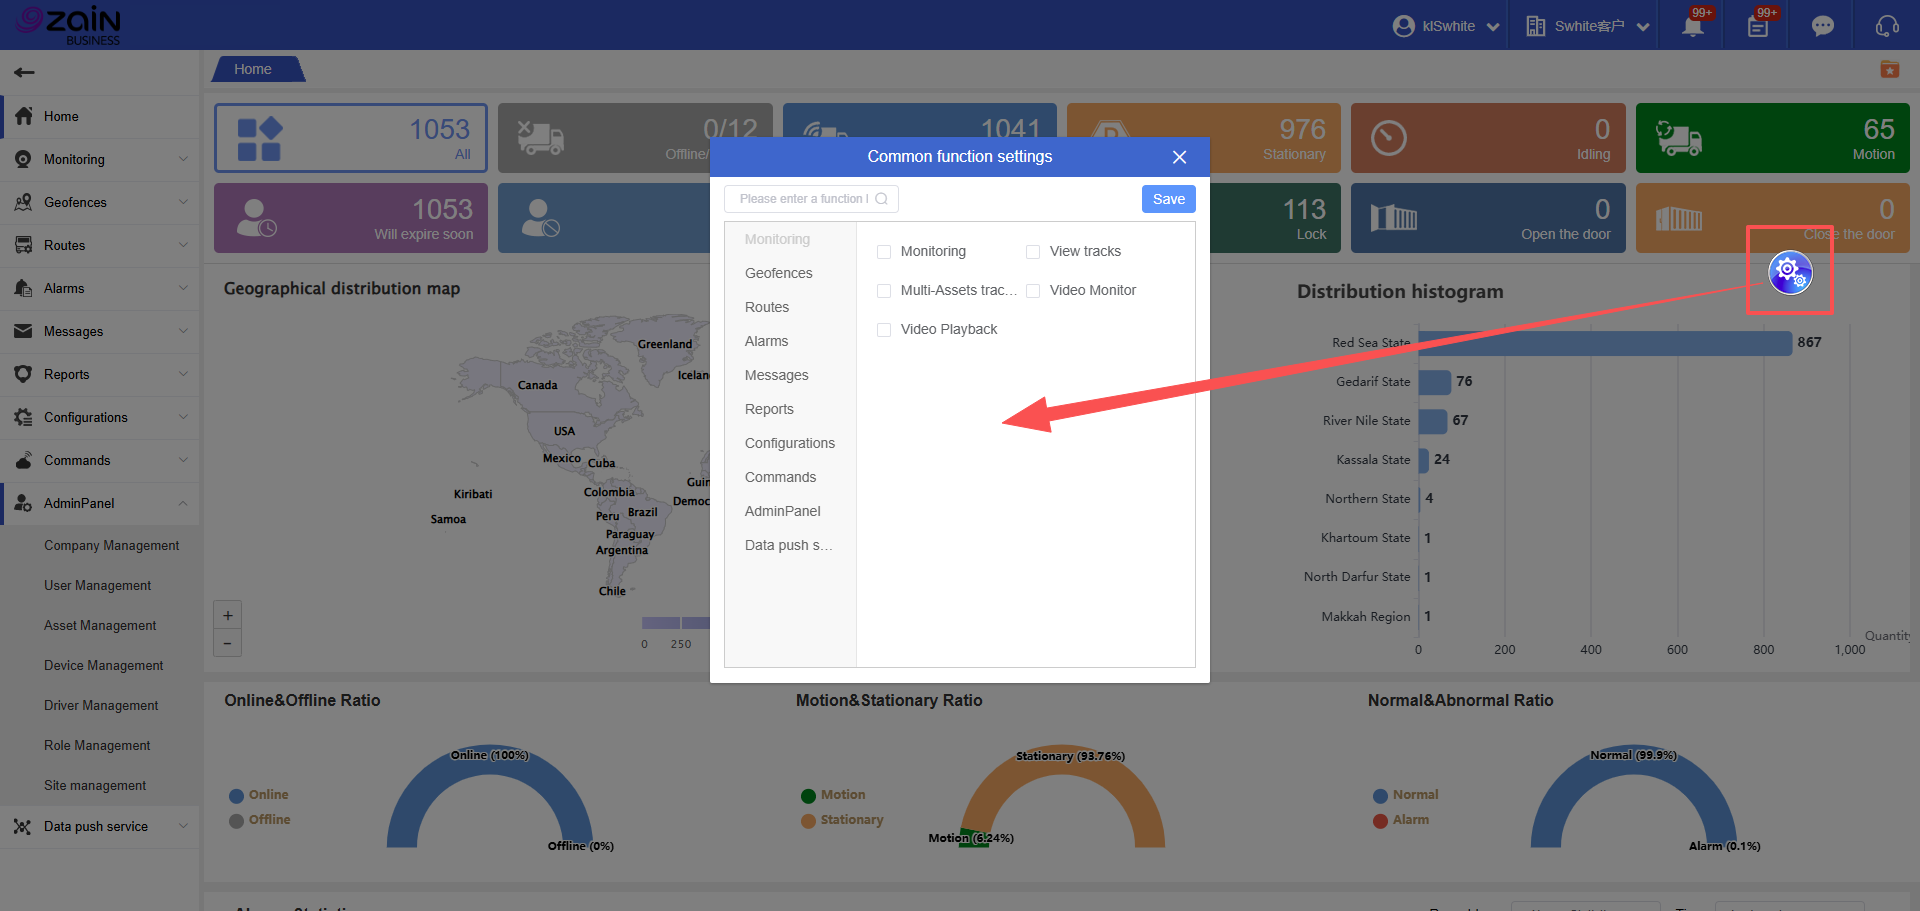
Device Operational Status Area: Critical Tool for Avoiding Service Interruption
This area provides rapid identification of real-time status for all devices, covering 14 core status categories (such as Online/Alarm/Low Battery).
Operation Steps:View Total Device Count: The “All” card in the upper left corner displays the total number of devices currently managed by the platform (e.g., 1053 devices in the example)
Identify Status Categories: Through “Color + Number” cards, quickly locate devices in target status:
Blue: Online devices
Red: Alarm devices
Orange: Low battery devices
Custom Status (Optional): Click the “+” button to add/hide specific status cards according to your business needs, adapted for personalized management scenarios in cross-border transportation.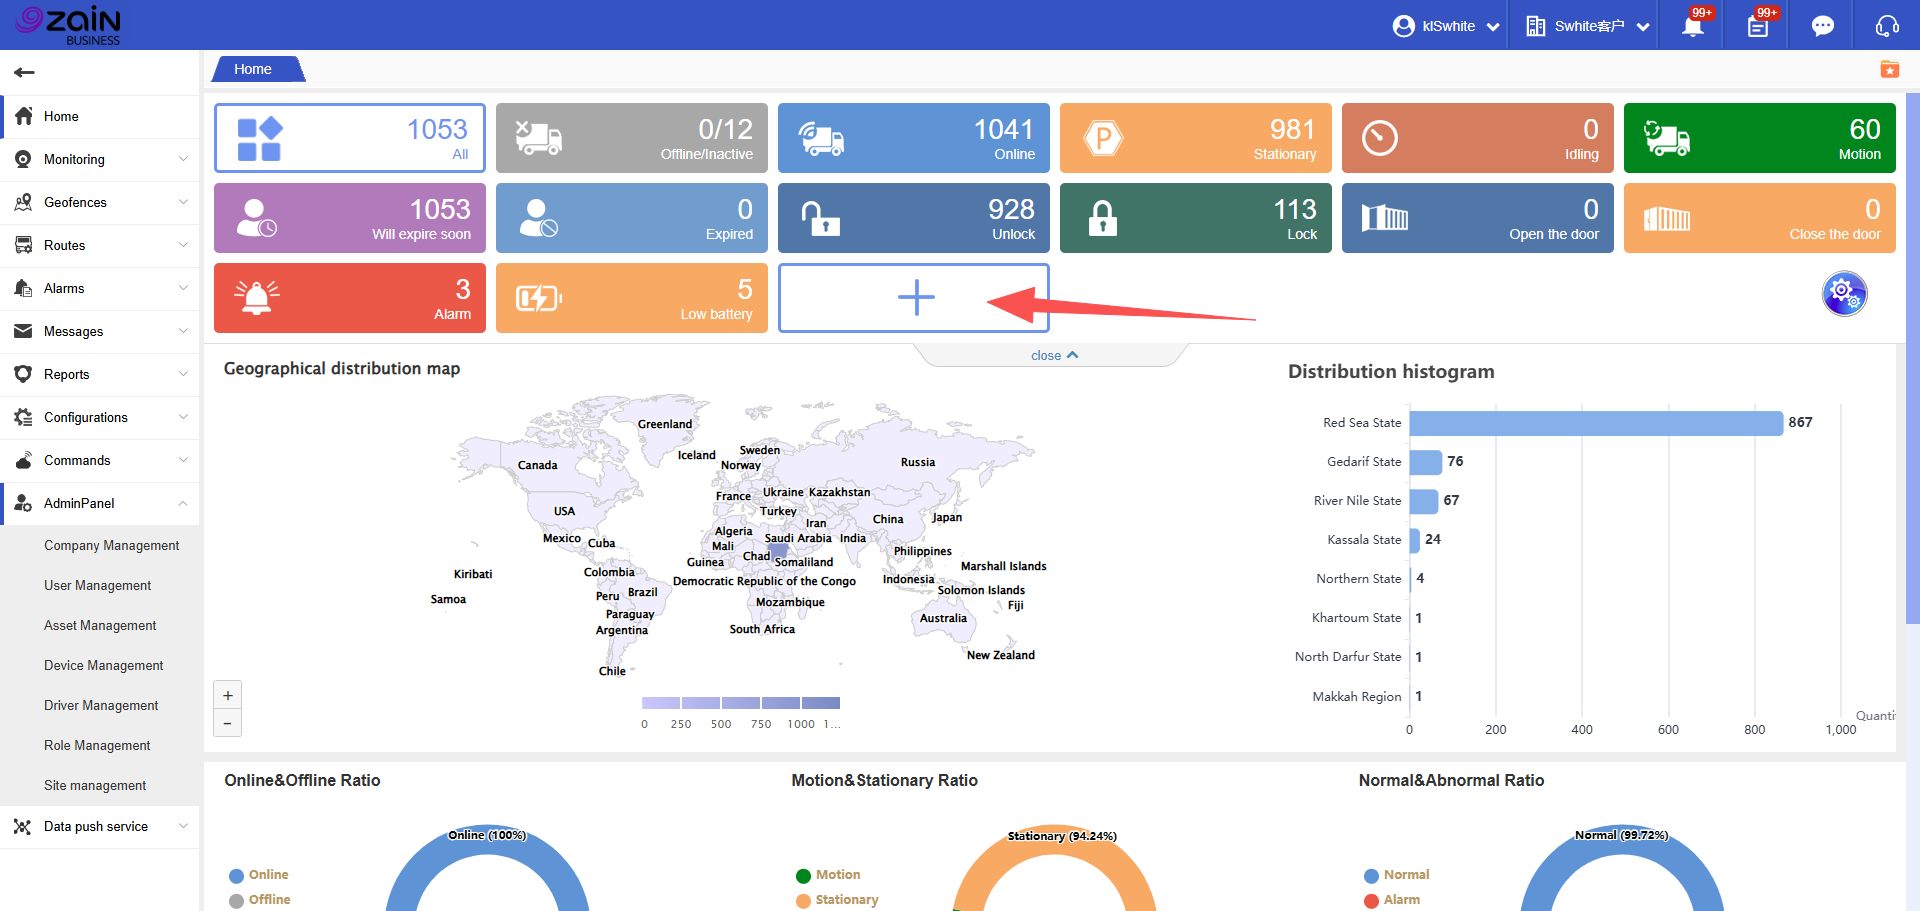
Additionally, the dashboard displays various dimensional data analysis and proportion charts.