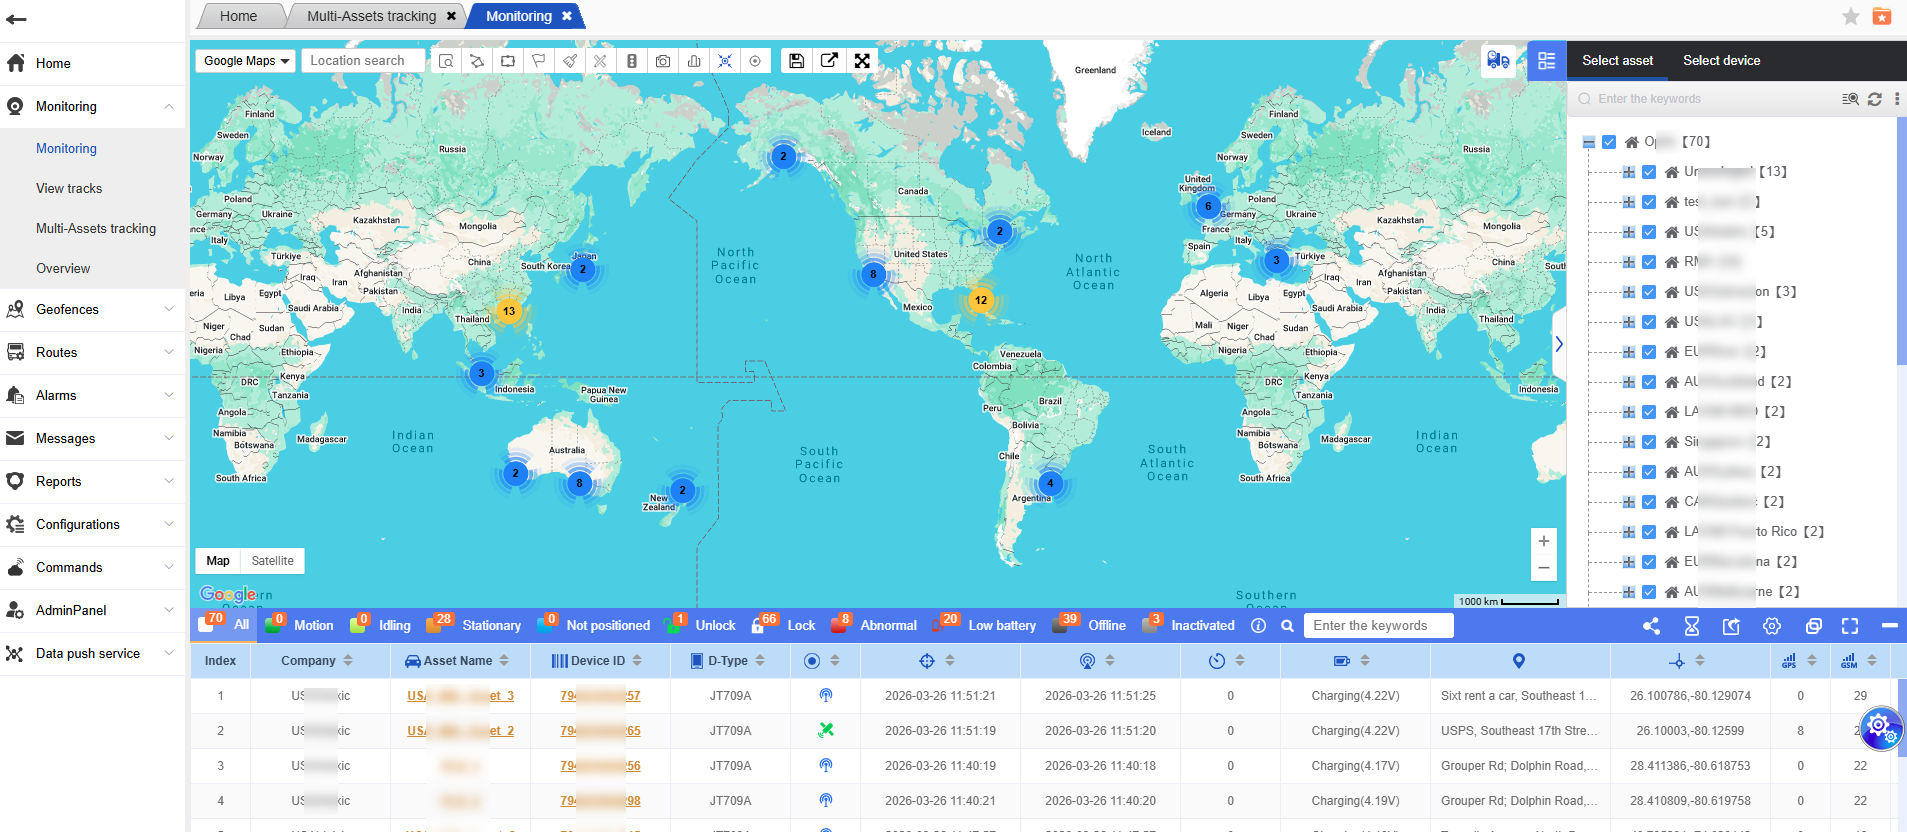
Here is the interface of the real-time monitoring system: On the right side, there is a list of vehicle trees; in the middle, there is a map positioning area; and at the bottom, there is a table showing the details of the positioning information. Through this system, you can view and manage the positioning information of vehicles in real time, and perform related functional operations.
Left-side menu bar usage instructions
Expansion and Collapsion
Collapse operation: Click the left arrow icon at the top of the menu bar to collapse the menu into a simplified mode (only keeping the navigation icons).
Expand operation: Click the vertical three-dot icon displayed after collapsing to restore the full navigation bar.

Instructions for Using the Top Navigation Bar
- Box Selection Search:
You can select the vehicle icon on the map with box selection, and a pop-up window will display the detailed information of the device. It also supports exporting the information in Excel, PDF or Word formats.

- Create a fence:
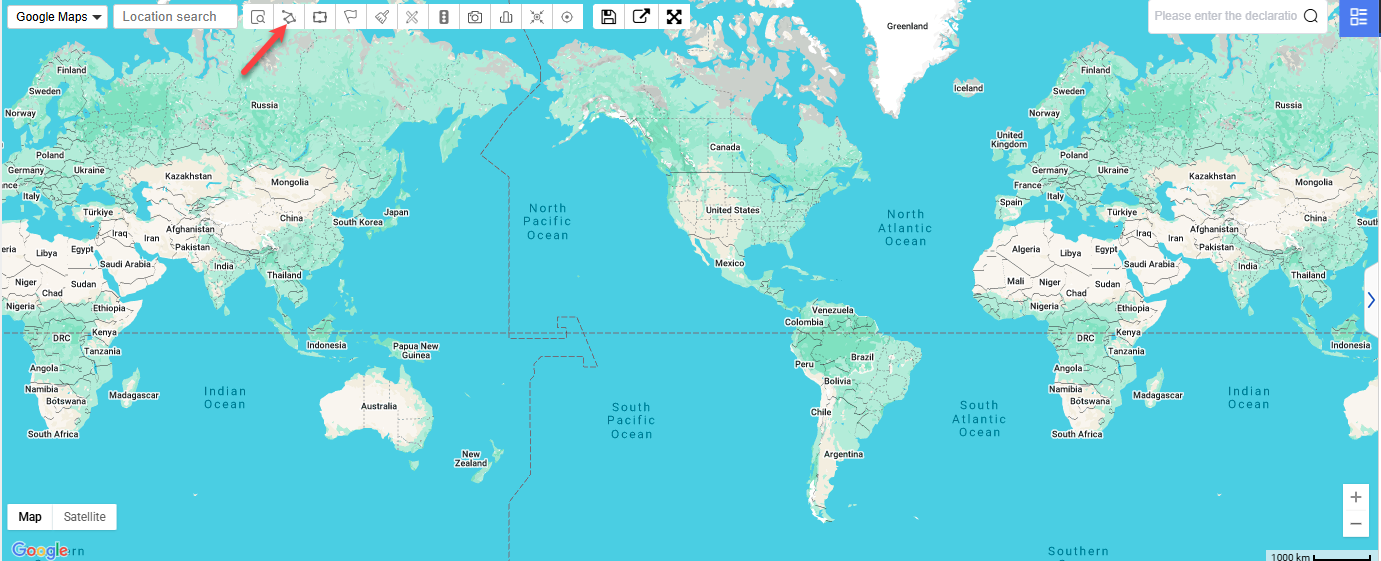
Click to enter the “Create a fence” interface; follow the prompts on the page to set the fence information. Once the fence is drawn successfully, you can choose to reset or redraw it.
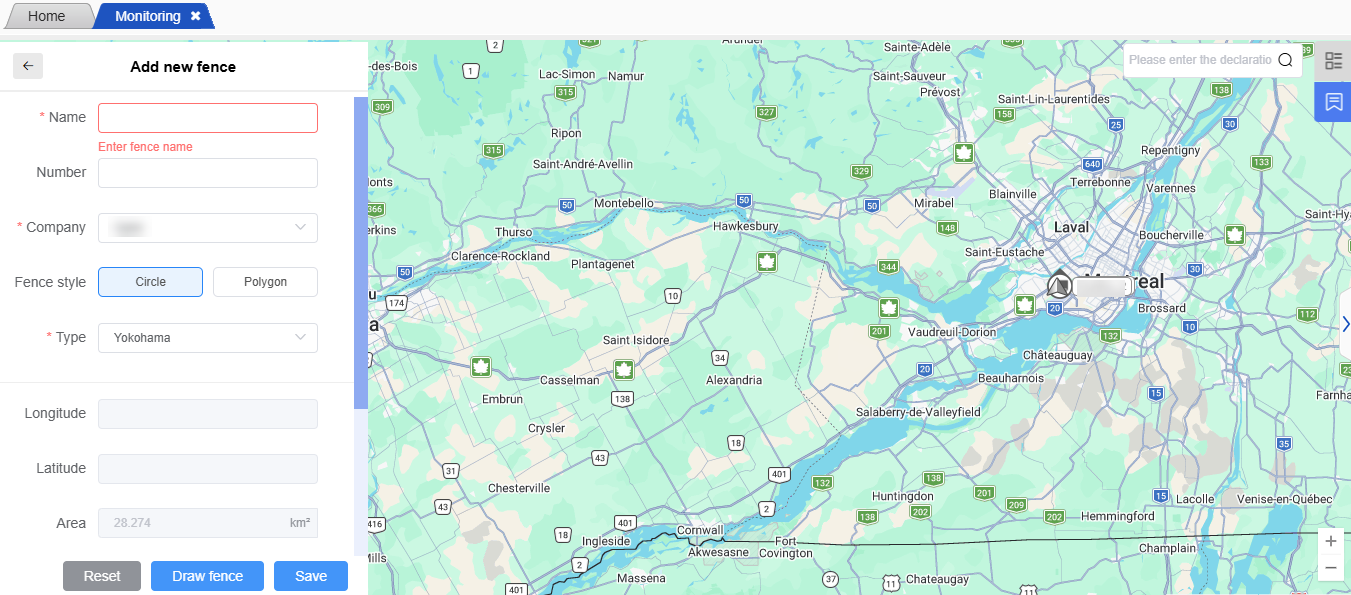
- Show fence:
Click to select the fence, then in the fence organization tree, select the fence information you want to query. After checking the fence, it will be displayed in the map view.
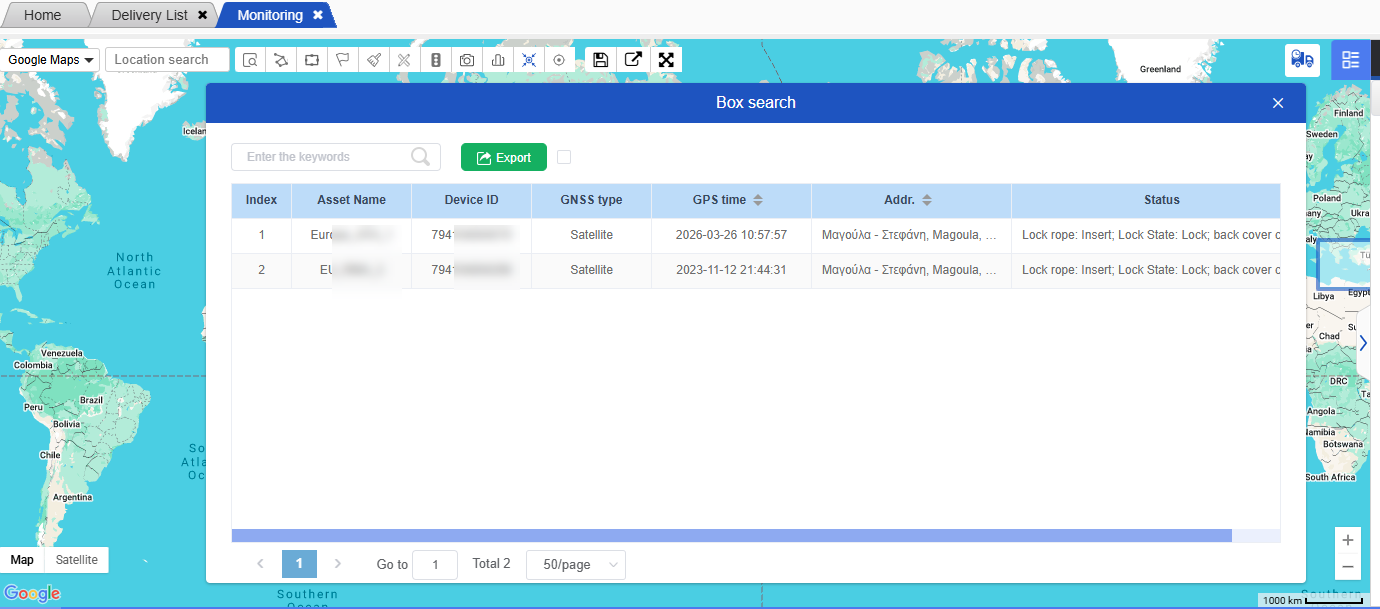
- Show hotspot:
After clicking the “Show hotspot” button in the toolbar at the top of the map, select the hotspot name from the organization tree. The existing hotspot locations will be marked on the map (as shown in the “test” hotspot in the picture).
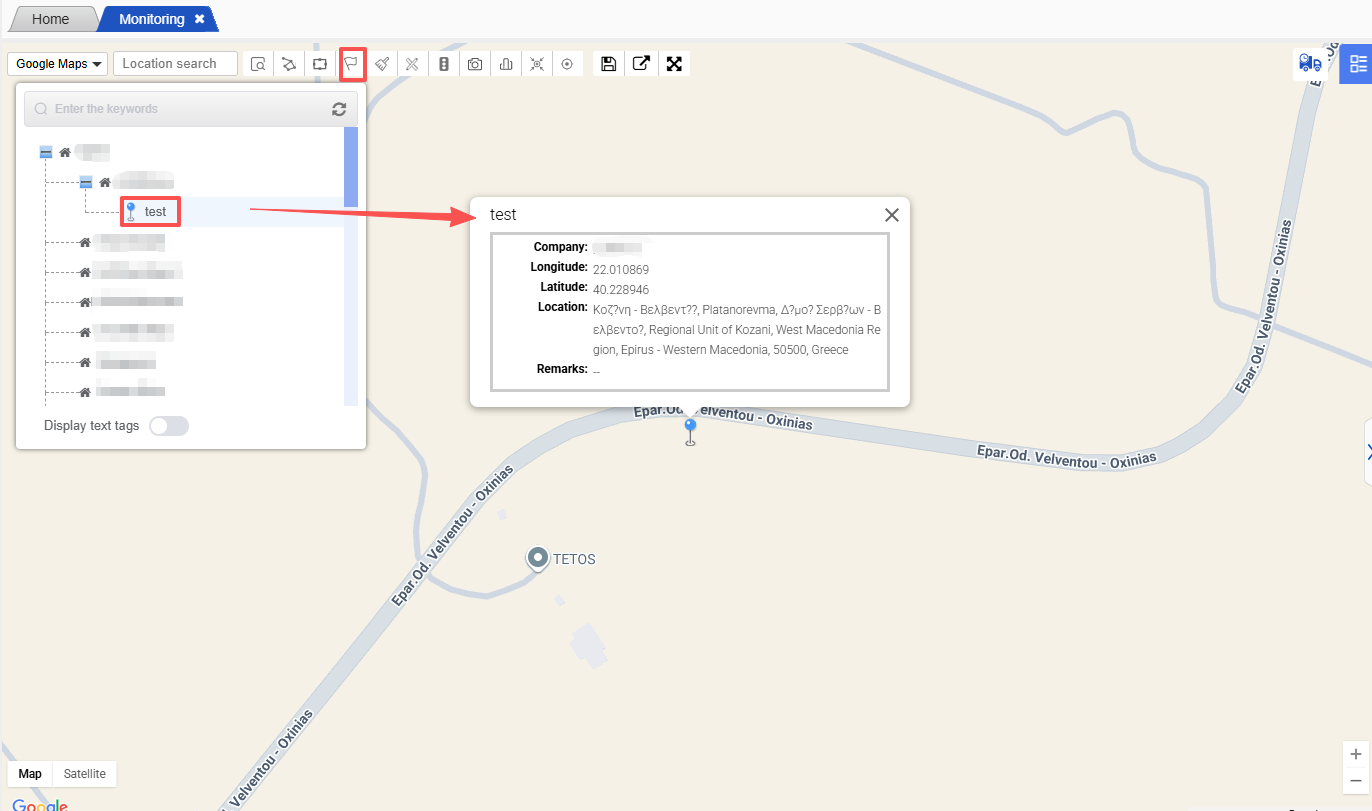
- Clear all fence/hotspot information:
Quickly clear the display of page hotspots / fences queries.
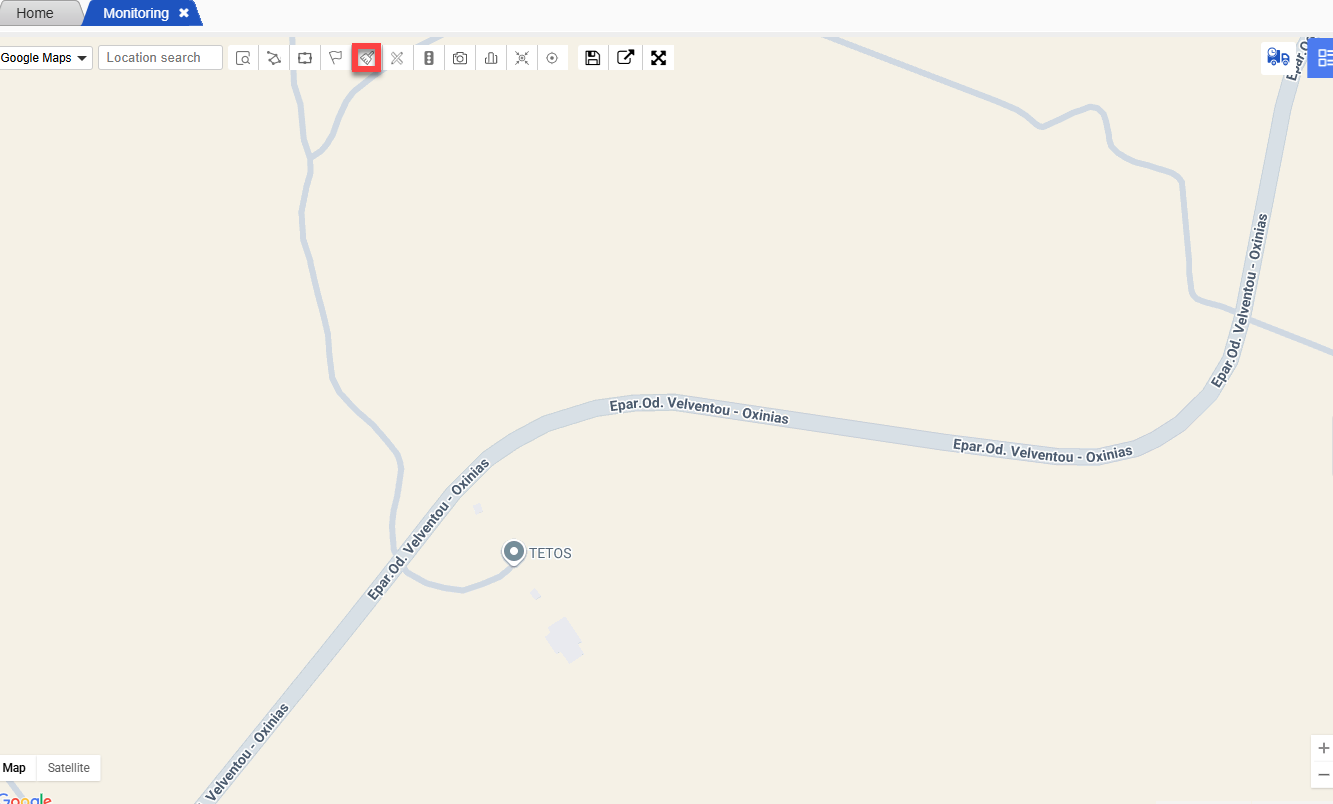
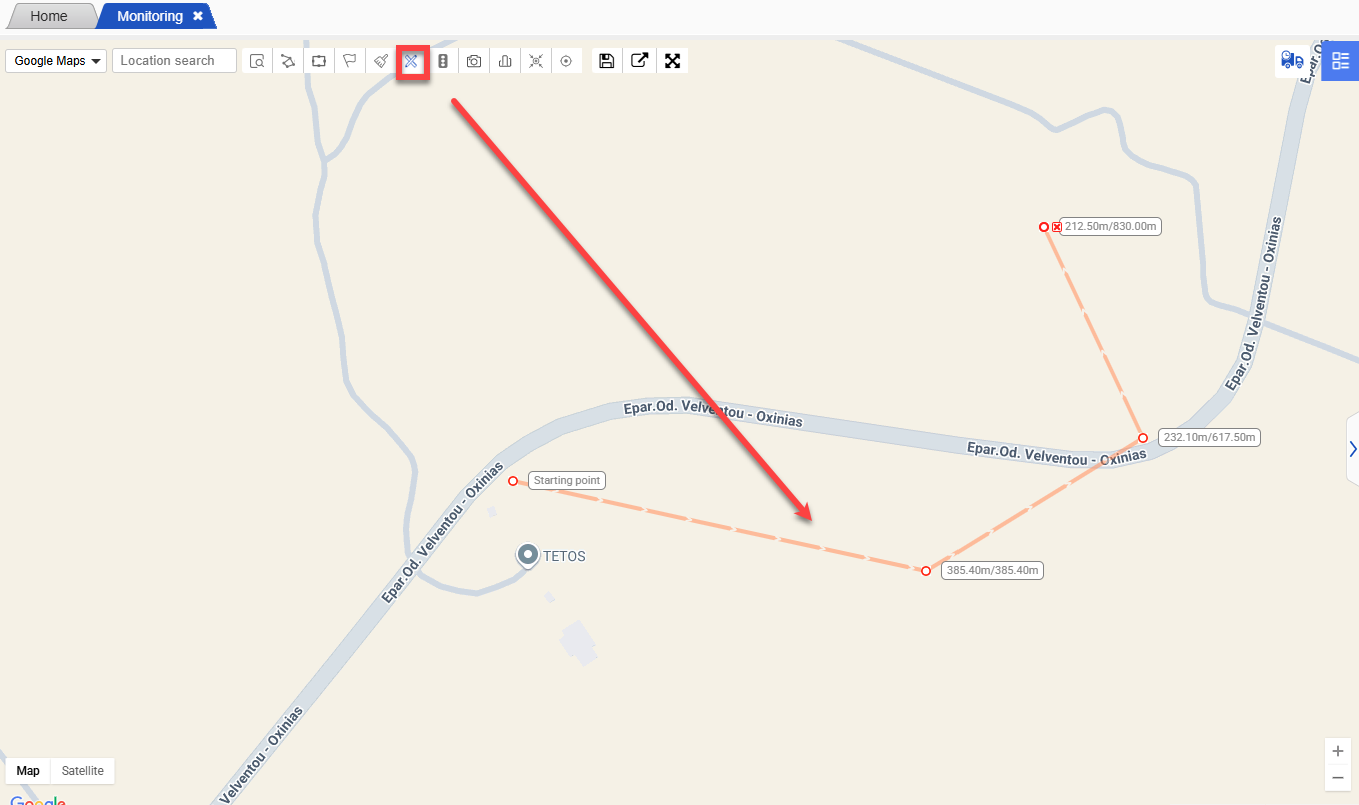
- Ranging:
After enabling the Ranging function, simply click on the starting position where you want to measure the distance on the map, marking it as “Starting Point”. Then click on the subsequent locations or the ending position one by one. The map will display the distance of each segment and the total distance in real time.
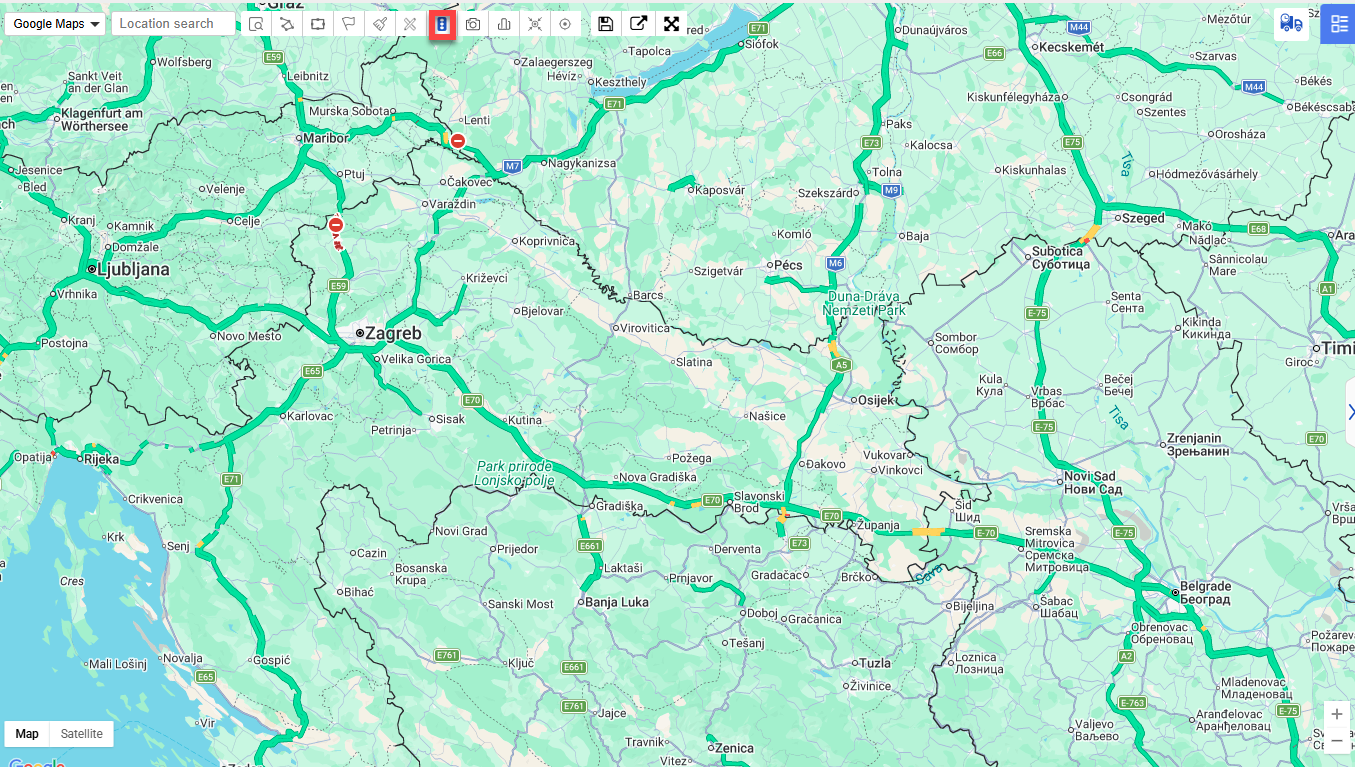
- Road condition:
Click the icon button marked “Road condition” on the toolbar above the map. The real-time traffic conditions of the roads will be displayed in different colors on the map. Green indicates smooth traffic, yellow indicates slow-moving vehicles, and red indicates traffic congestion.
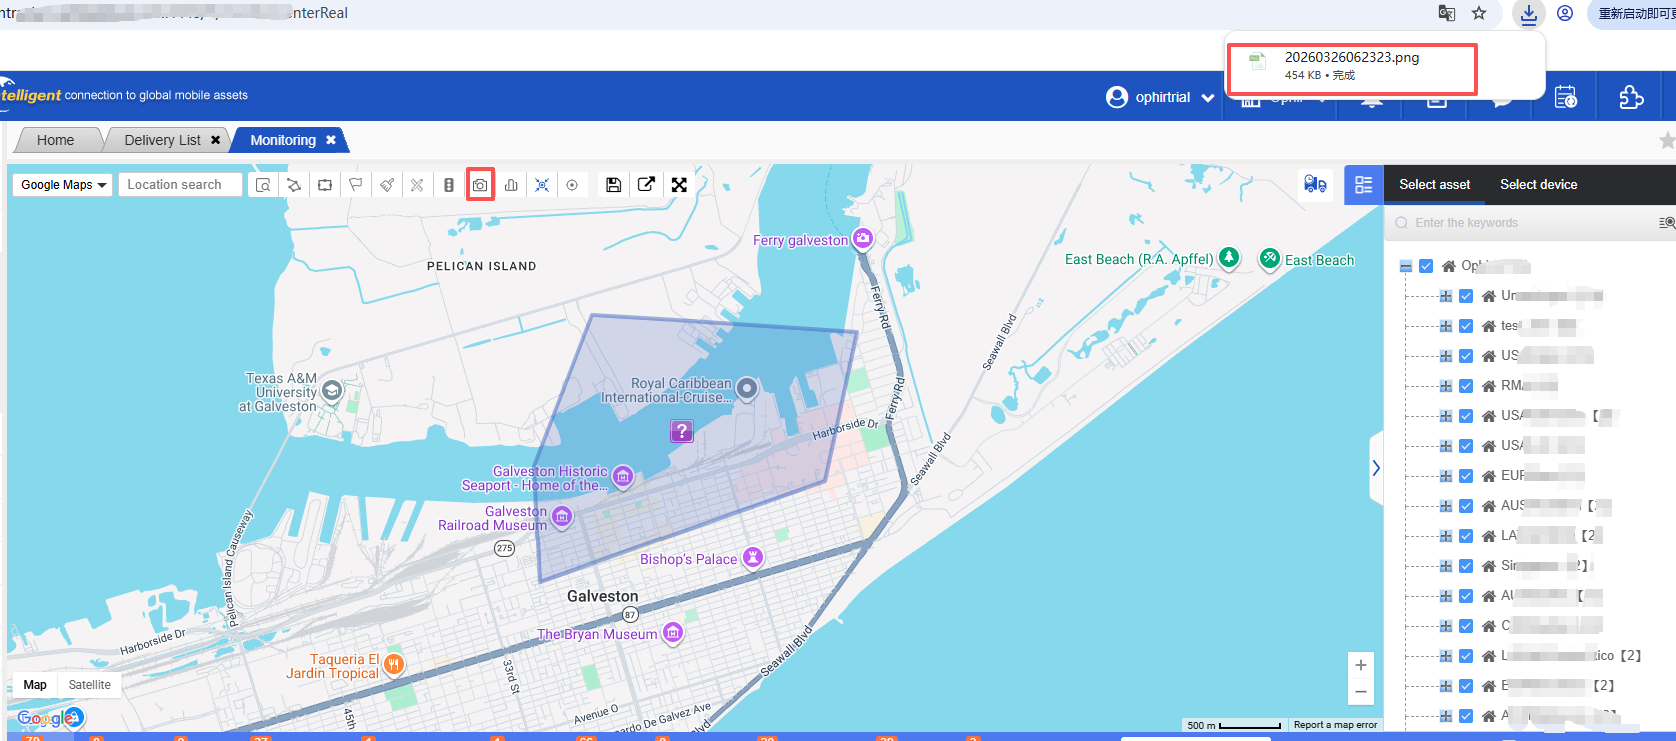
- Snapshot:
Take a one-click photo of the current map view and save it.
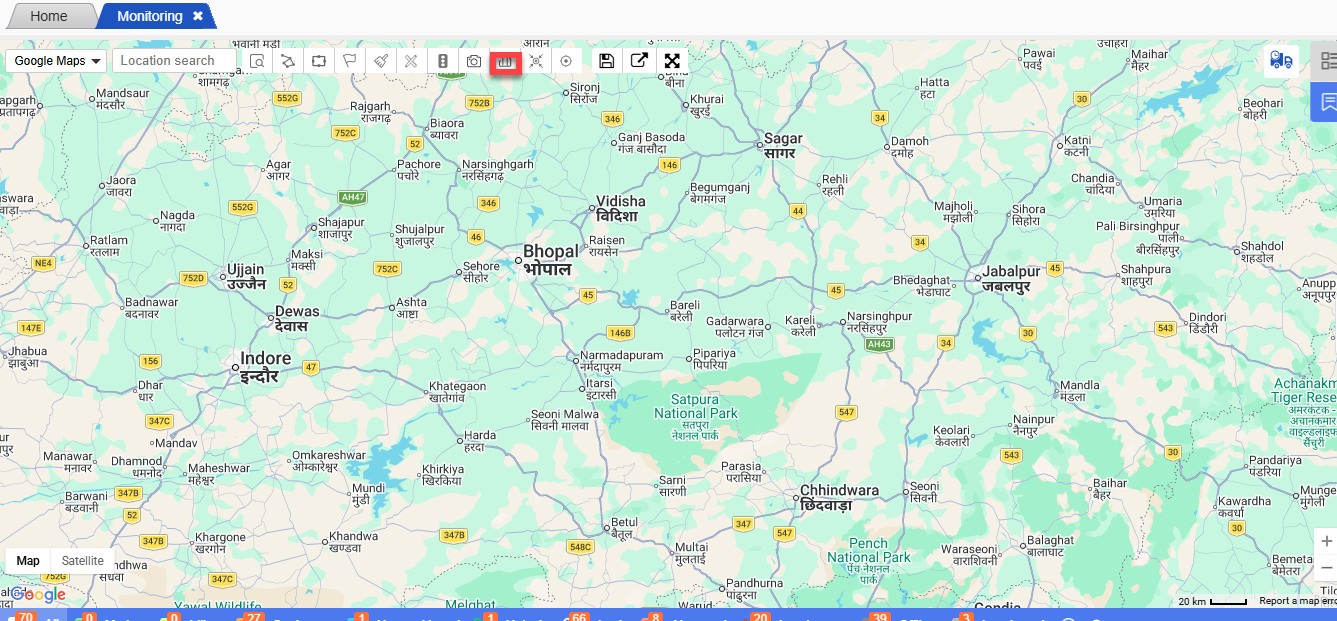
- Company area:
Quickly determine whether the associated equipment is within the company’s area.
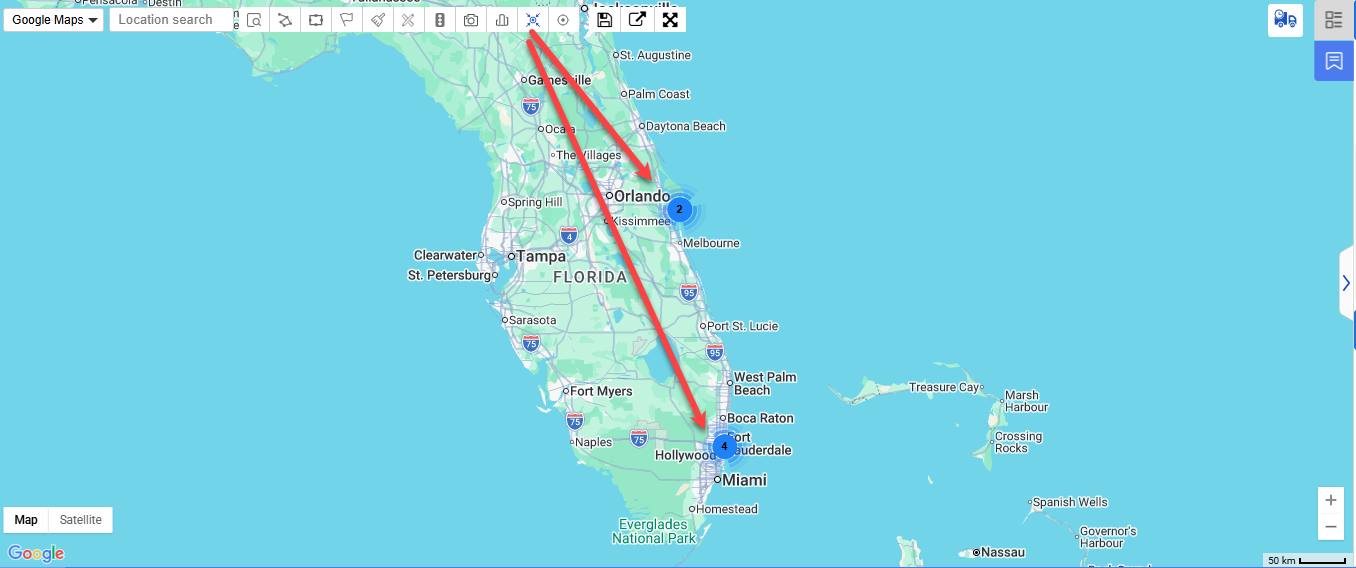
- Clusterer Markers:
Rapidly aggregate location information.
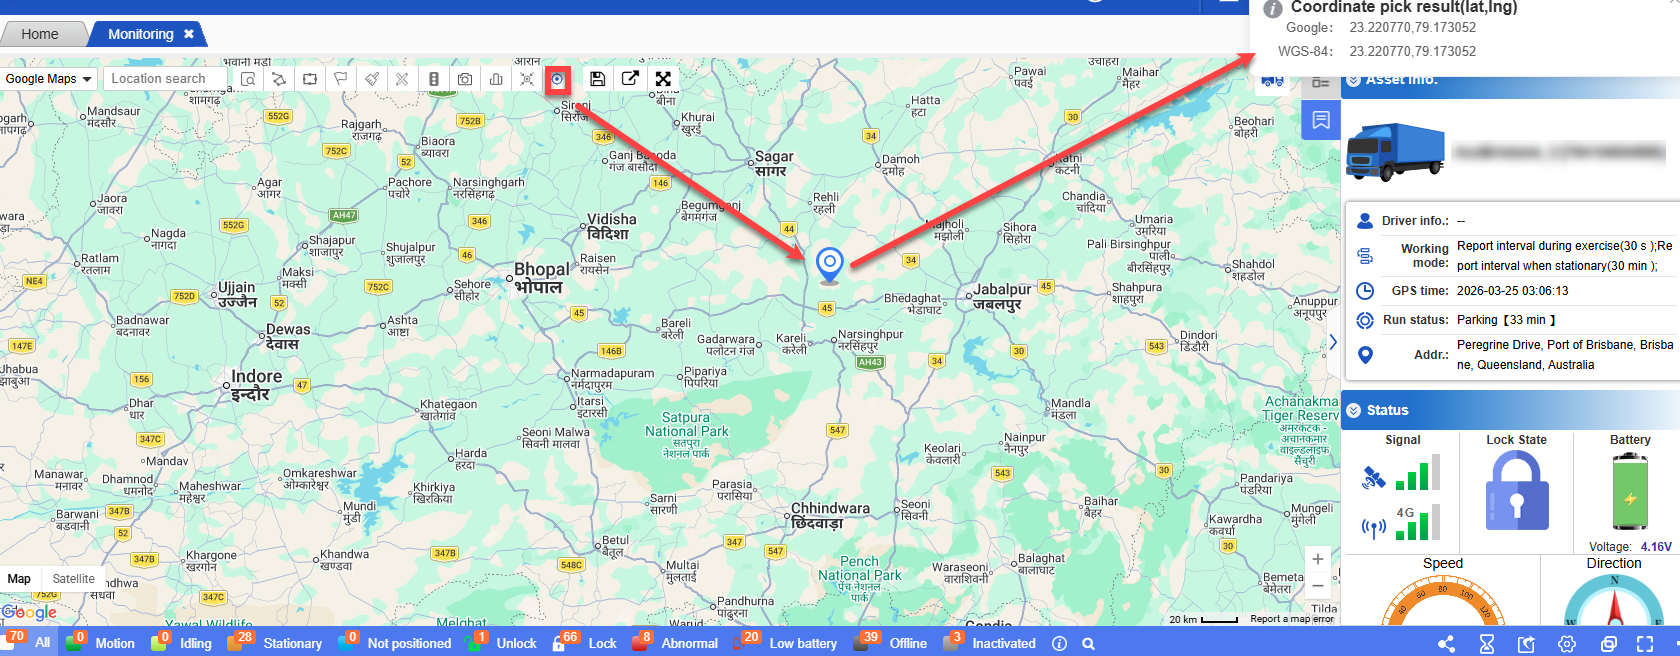
- Coordinate Picking:
Simply click on any location within the map view, and you can quickly obtain the latitude and longitude information.
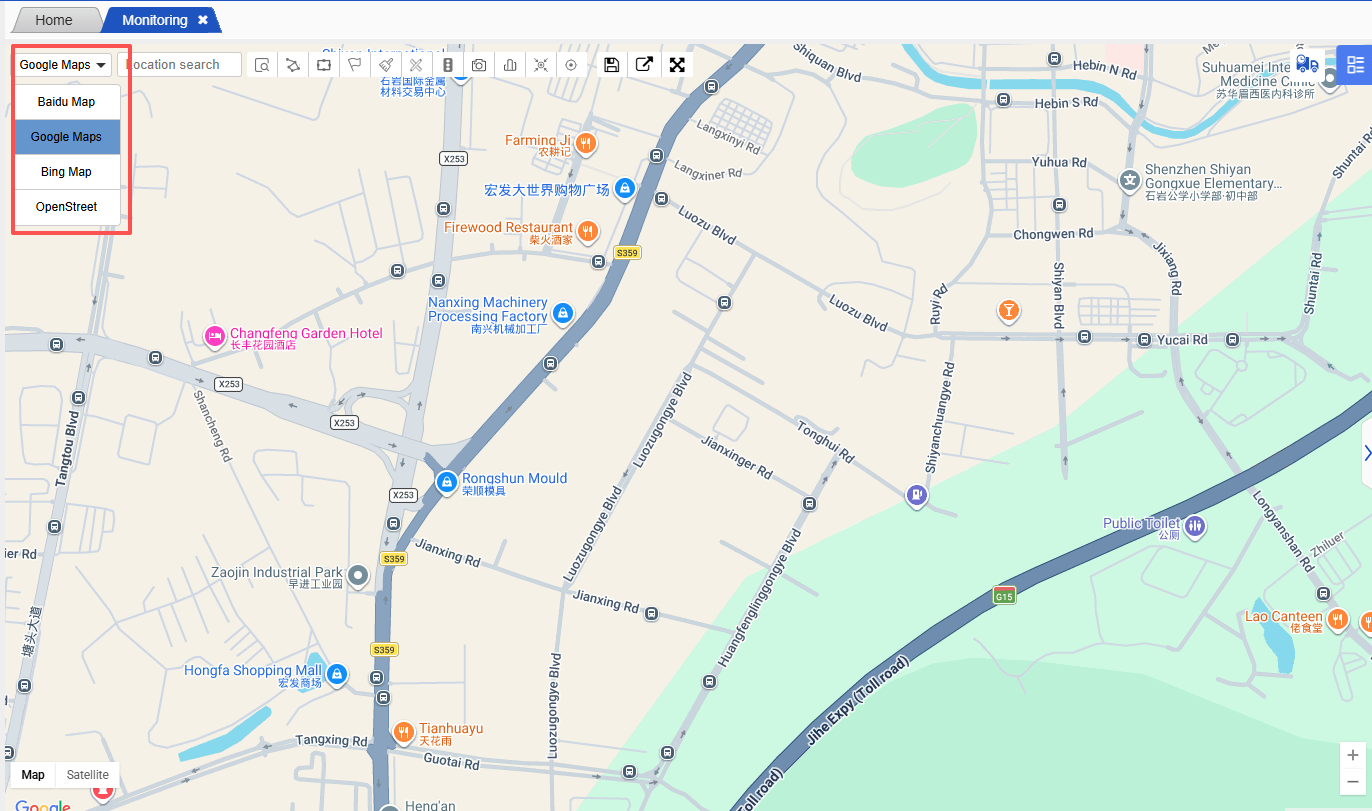
- Other functions:
The map view supports map switching.
- Delivery Document Inquiry:
Support the quick query of equipment information through the tracking number.
Instructions for Using the Right Side Organization Tree
The vehicle tree on the right displays all the company, group (fleet) and individual vehicle information that can be managed by the current account. By selecting a certain company, group or vehicle, its location information can be displayed on the map in real time. The functions available at the bottom of the pop-up window are (view tracks, replace device, remote unlock, unlock auth, dynamic unlock password).
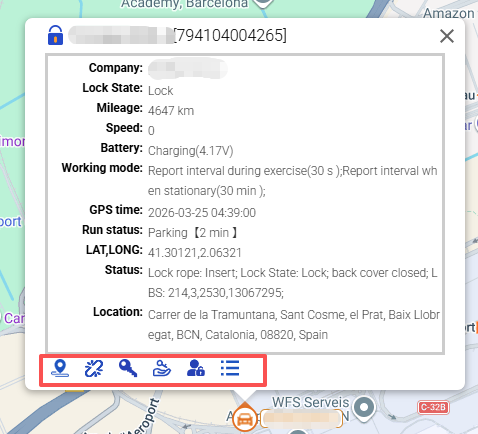
The bottom data column shows:
After selecting or checking the vehicle compartments (equipment) on the right side, the corresponding data will be displayed simultaneously in the bottom data column. The detailed data including company, asset name, device id, device type, and positioning status will be shown.

- Asset sharing:
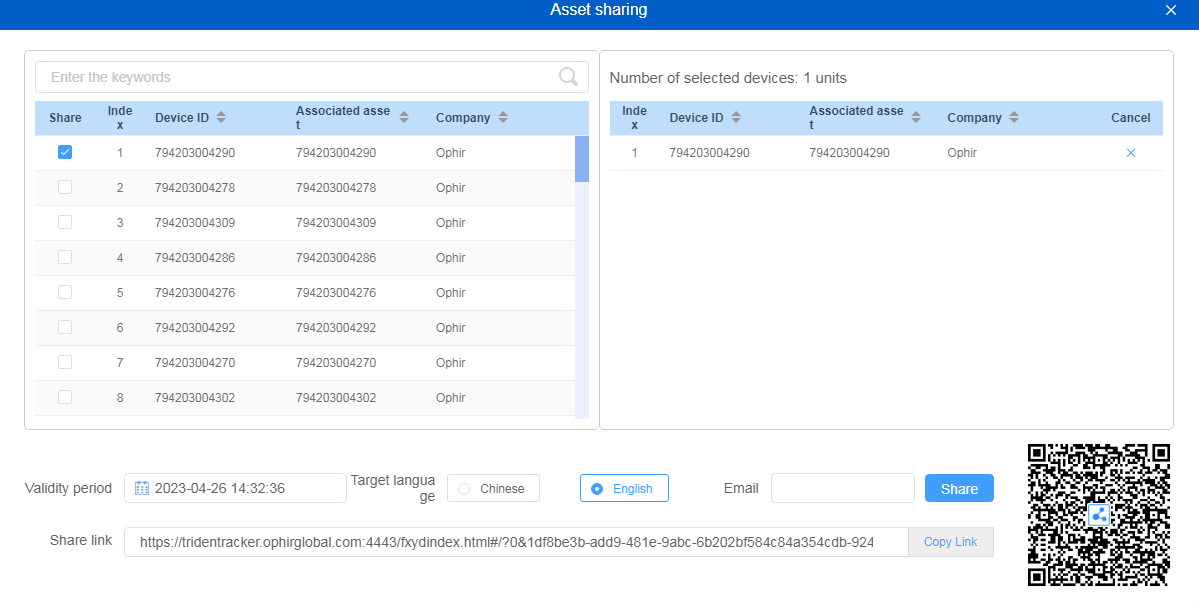
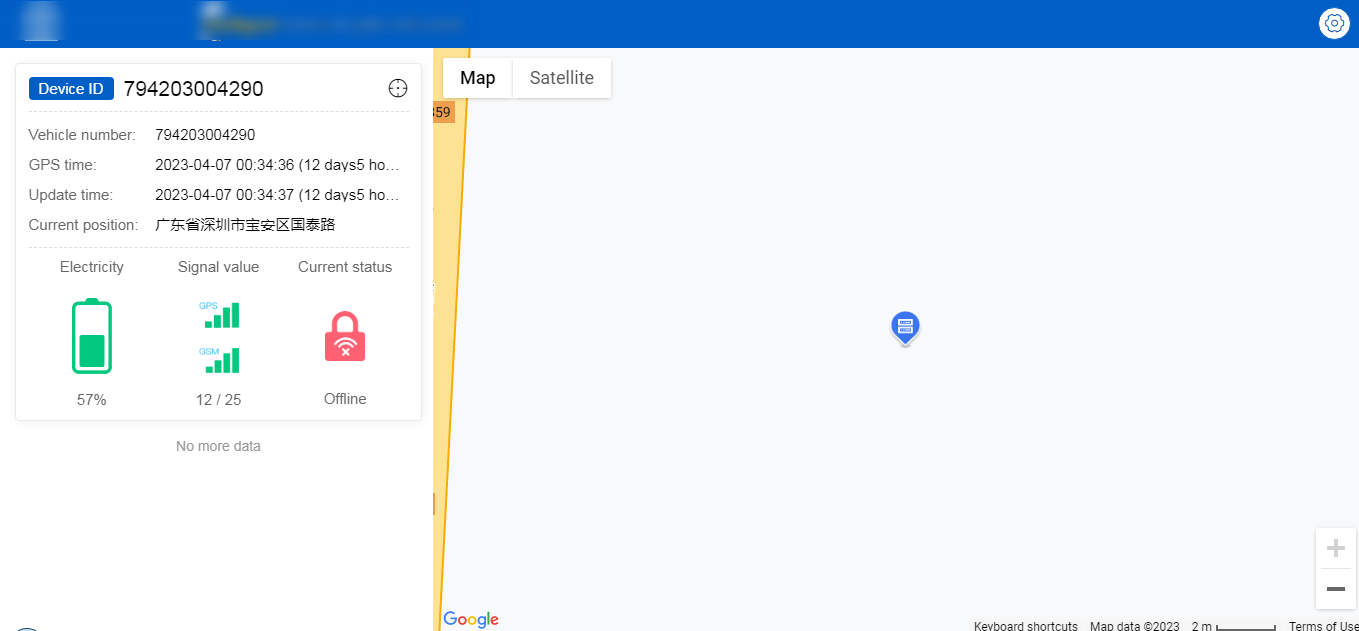
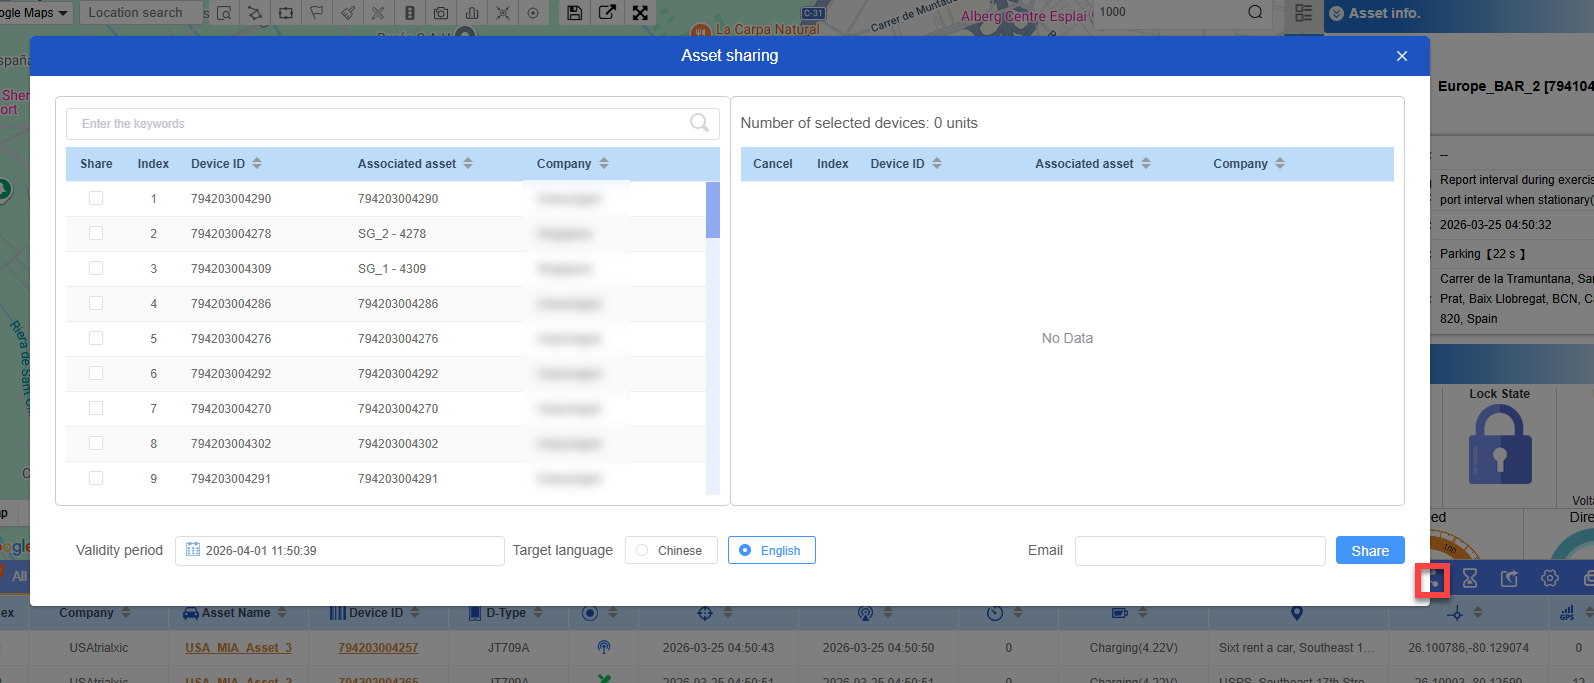
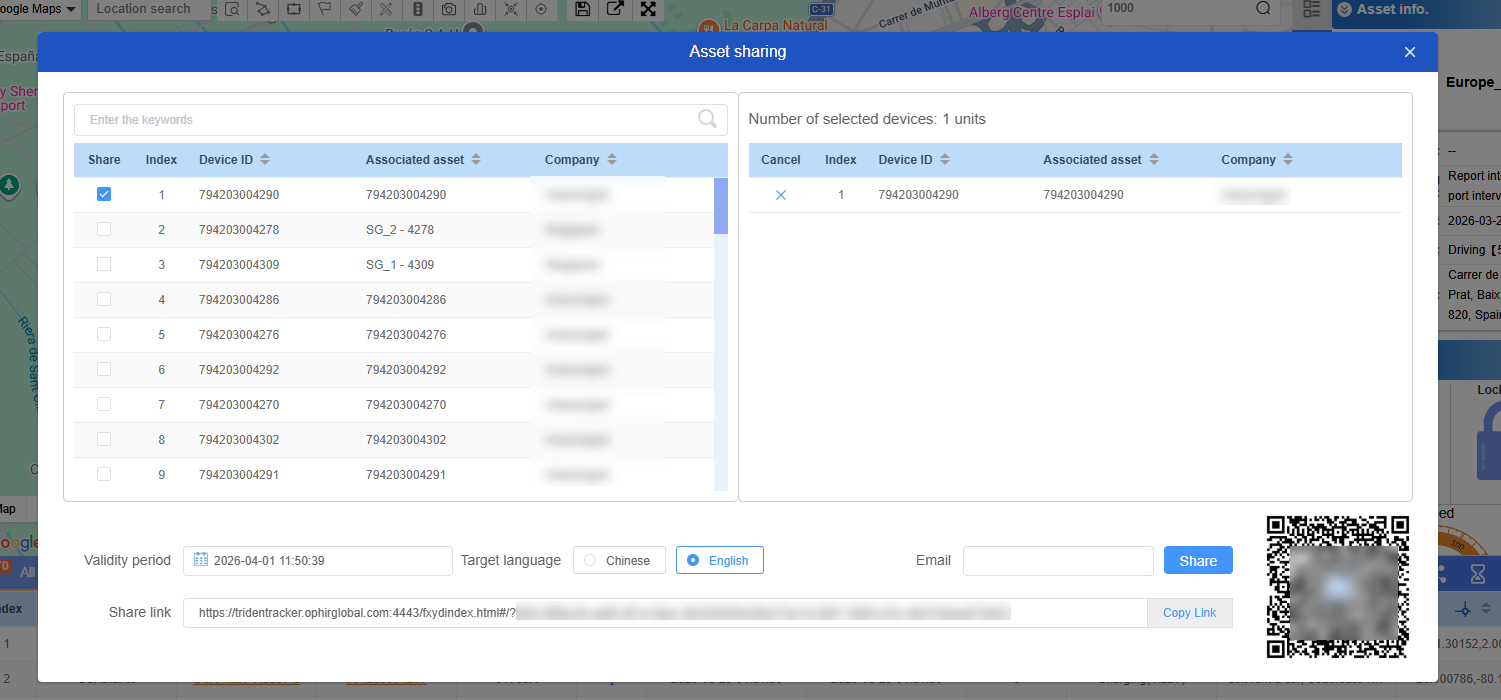
Click on the “Asset Sharing” option in the bottom data column. You can select one or more devices, and share the device data information with relevant personnel via email, link or QR code.
- Refresh frequency:
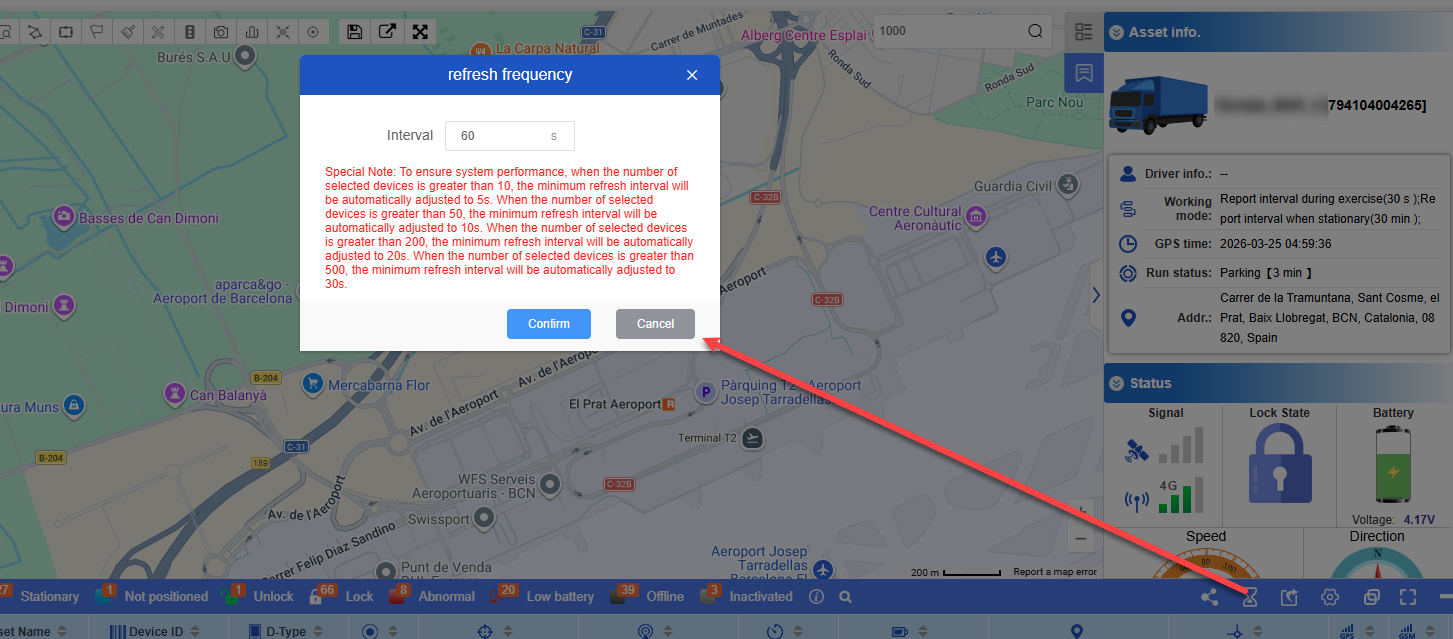
Support modifying the page refresh frequency.
- Data export:
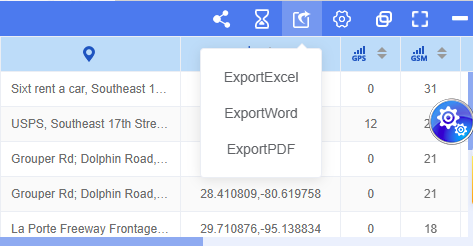
Bottom data supports export.
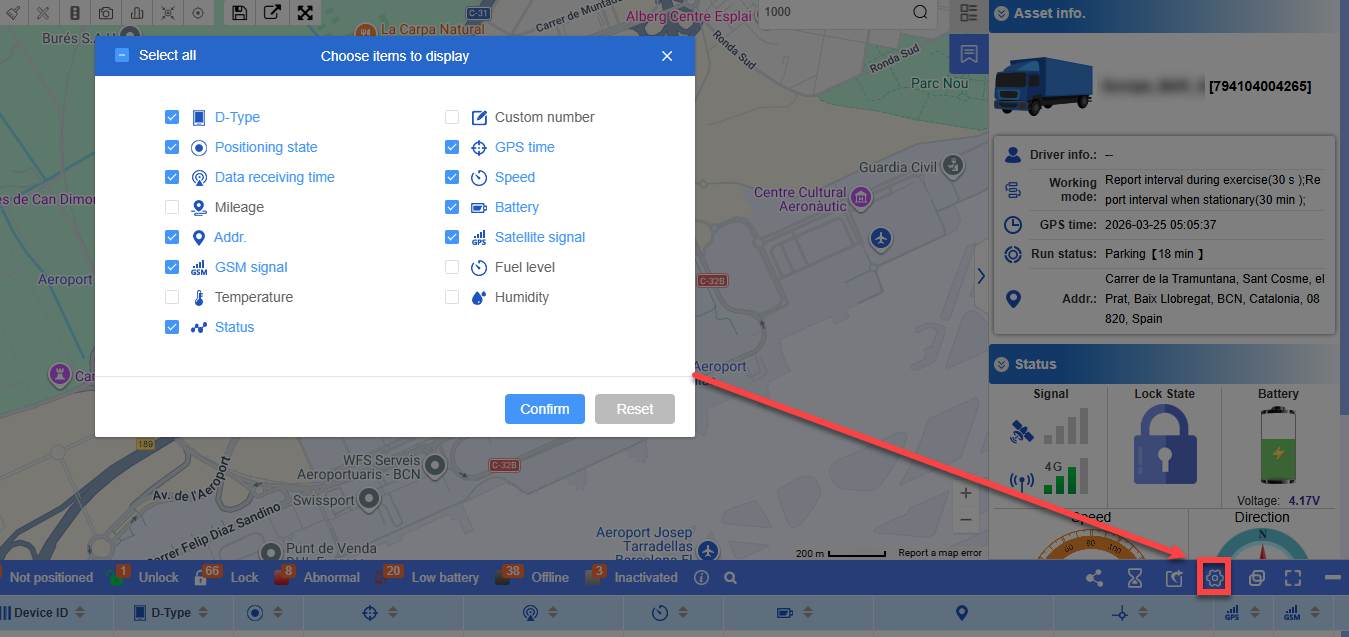
- Custom display:
The monitoring page field display supports custom configuration.
Top navigation bar ribbon
Located in the upper right corner of the page, it contains system logo, user information, company information, and quick operation entrance (alarm notification, message, and other icons).

Show/Hide floating ball
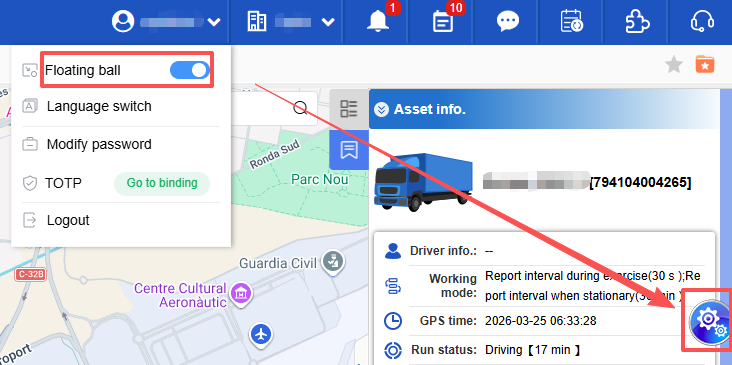
Turn off/on alarms, event pop-ups and reminder sounds

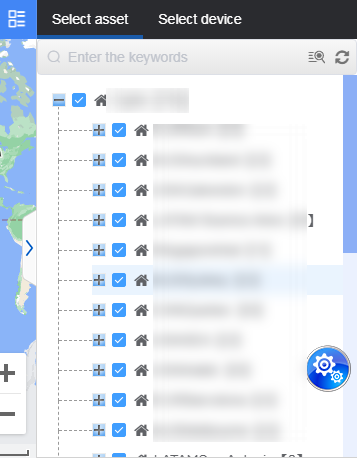
Asset selection area on the right
On the right is a assets tree, which displays the asset tree list of all companies that can be managed by the current account. Select a company, group or single asset can see the asset’s location information in real time on the map;
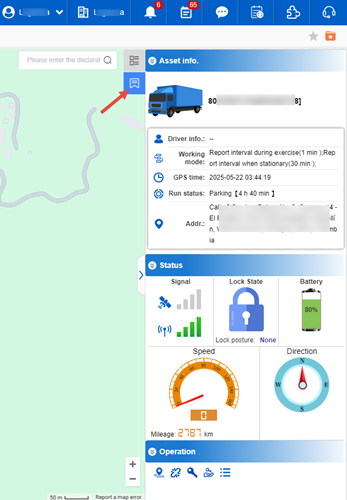
Device details Tab:
This area displays comprehensive information about the selected asset (such as a vehicle), including basic asset identification, operating status (GPS time, operating status, address), and status parameters (signal, lock status, power, speed, direction, etc.)
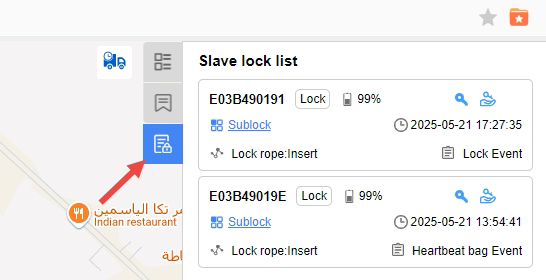
Sub-lock list Tab:
This area displays detailed information of multiple sub-lock devices, such as sub-lock ID, lock status, updated data time, power, sub-lock unlocking button, etc., to facilitate monitoring the real-time status of each sub-lock.
Bottom information list area
The lower part is a detailed table of positioning information, which is displayed according to the state of the asset;

Select a asset to display the detailed information of the current asset;
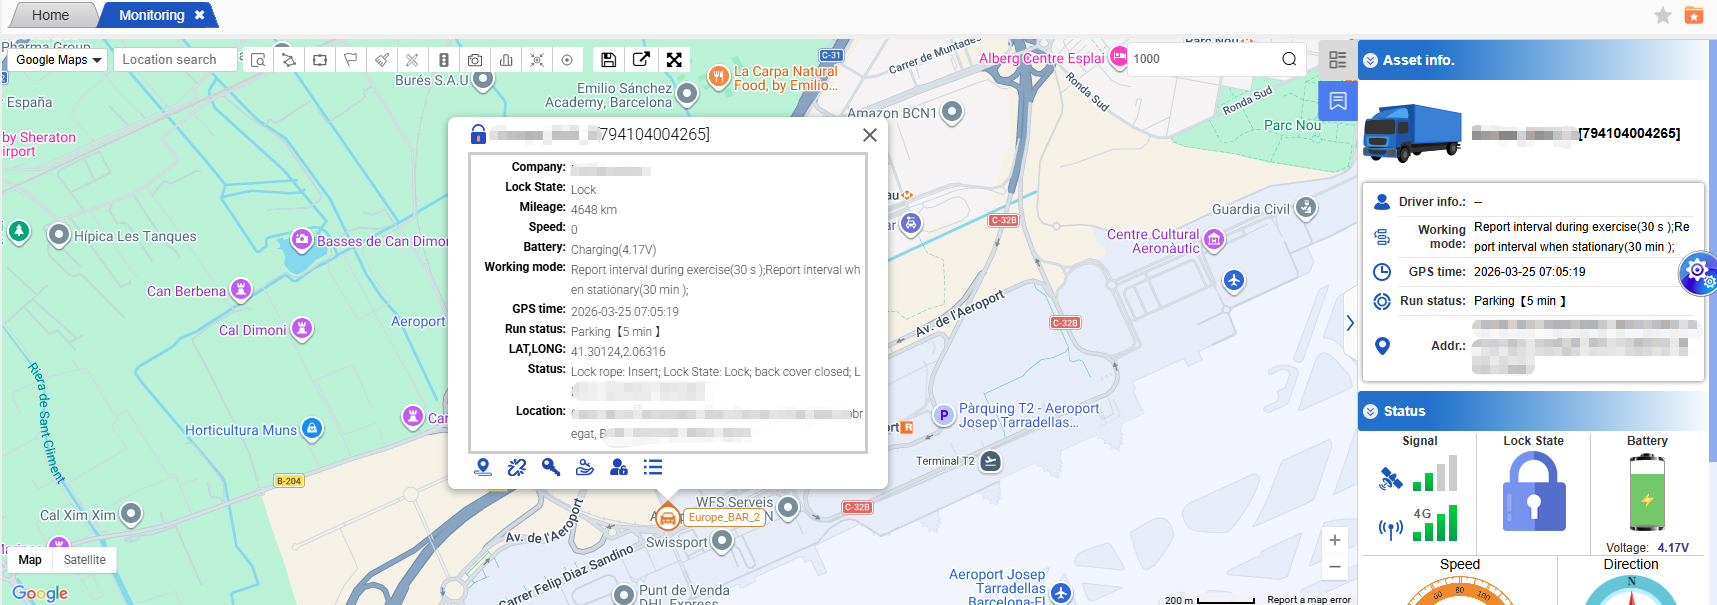
Different states and operations can be displayed in the bullet frame and the status information bar on the right according to the type of device bound to the asset.
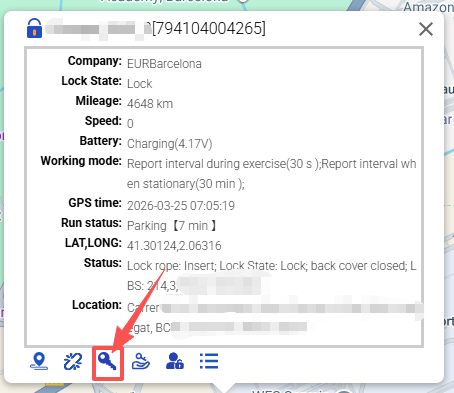
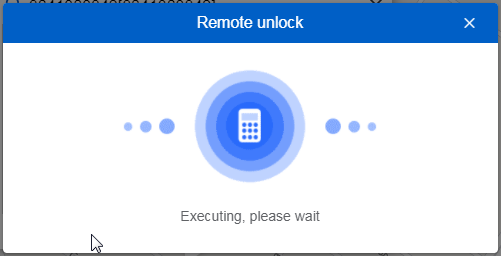
Click the corresponding operation button to jump to or pop up different operation boxes. Take the unlocking of JT701D as an example, click the key icon to perform the unlocking operation;
Click the operation button on the far right to perform the unlock authorization operation. You can temporarily authorize the unlocking authority of the lock to someone, enter the Email, authorizer and valid time.
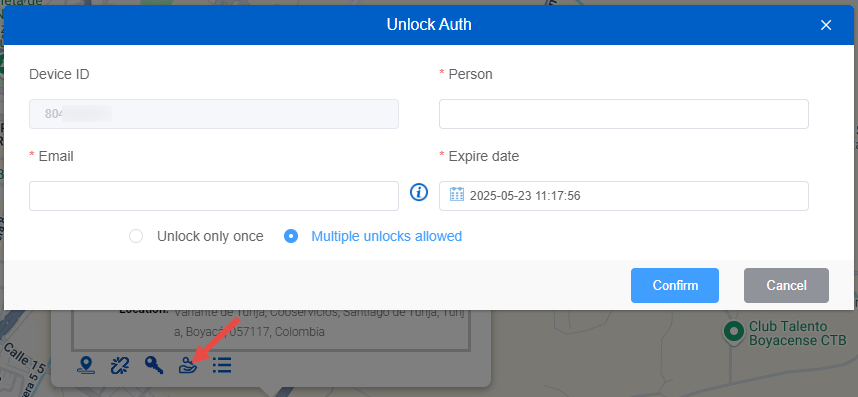
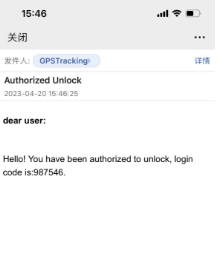
After the authorization is successful, the authorization code for this unlock will be automatically sent to the mailbox, and then you need to log in to Authorized Unlock, and scan the code to unlock after successful login;
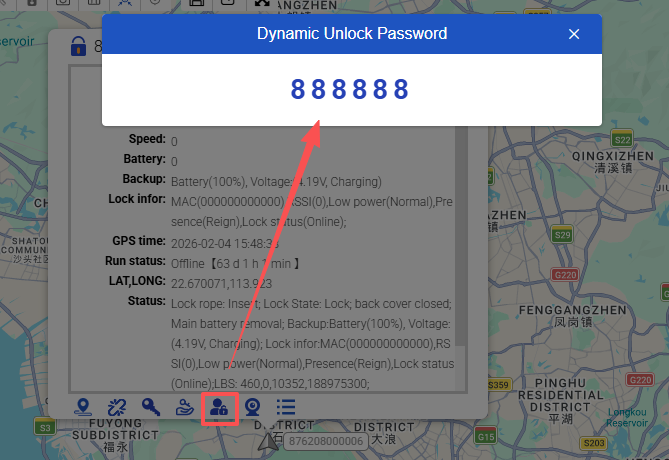
View the dynamic unlocking password
You can click this “Dynamic unlock password” button in the asset information bubble display box in the map display area to check the dynamic unlocking password.
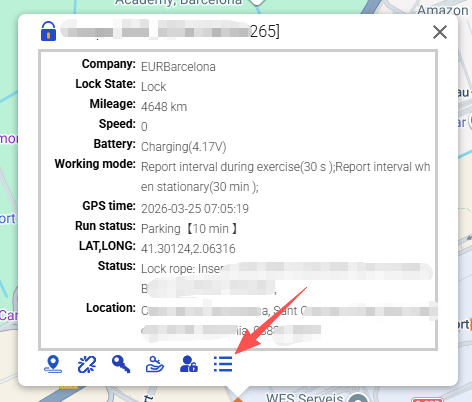
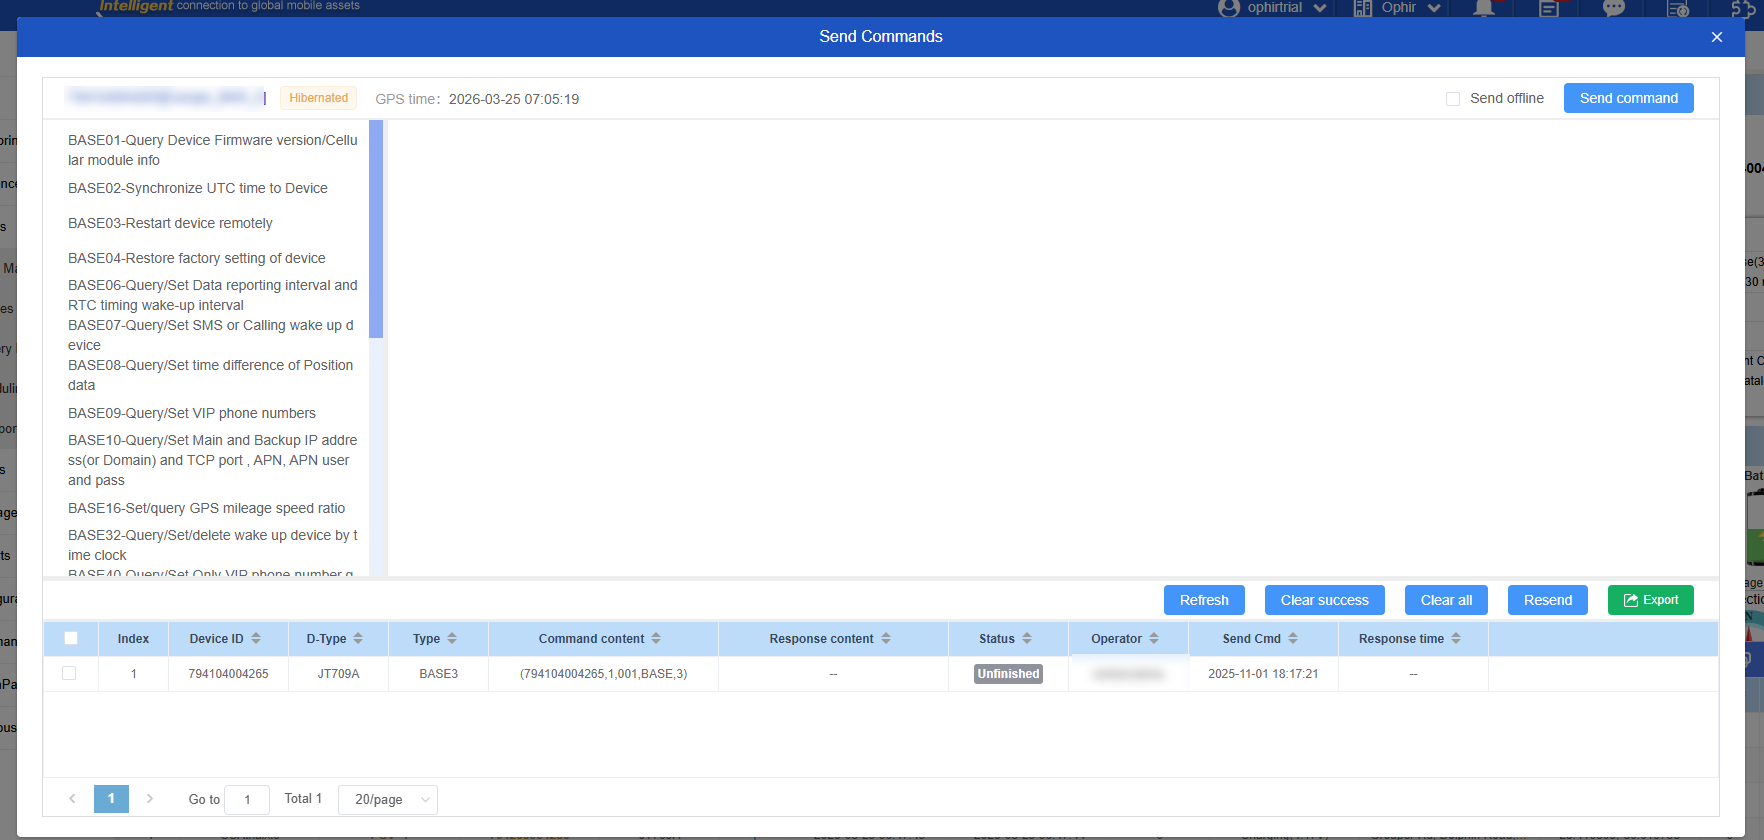
Send commands quickly
You can click the “More” button in the asset information bubble display box in the map display area to quickly send commands.
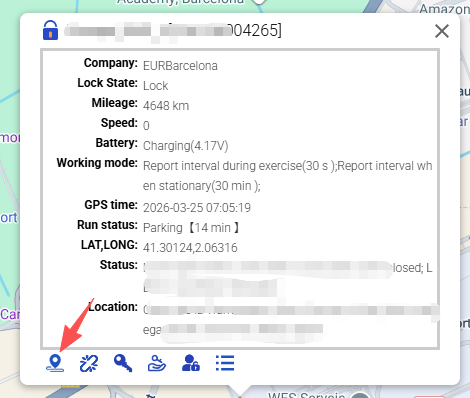
Quick View Tracks Button
Click this button to quickly jump to the View Tracks page
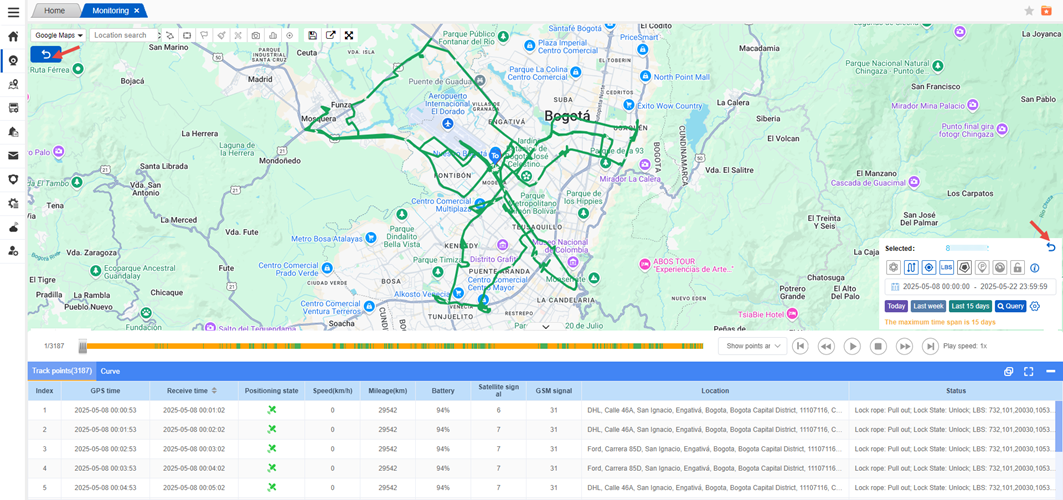
Click the U-shaped arrow button in the upper left corner/lower right corner to return to the real-time monitoring page
Map operation tool area
Contains map-related operation icons, such as map fence creation, fence display, hotspot display, clear page display fence/hotspot, distance measurement and other tools.

Delivery number search box

Users can enter the delivery number to interact with the asset filter search on the right. The delivery number comes from the chapter “Routes->Route Management”.

Page Tag Favorites:Save this tab to your favorites.

Bottom information list area operation tools

The sequence is: modify the refresh frequency, export the real-time data, select the display item content, the list box restores the default state, the list box is maximized, and the list box is minimized;
Modify refresh frequency:
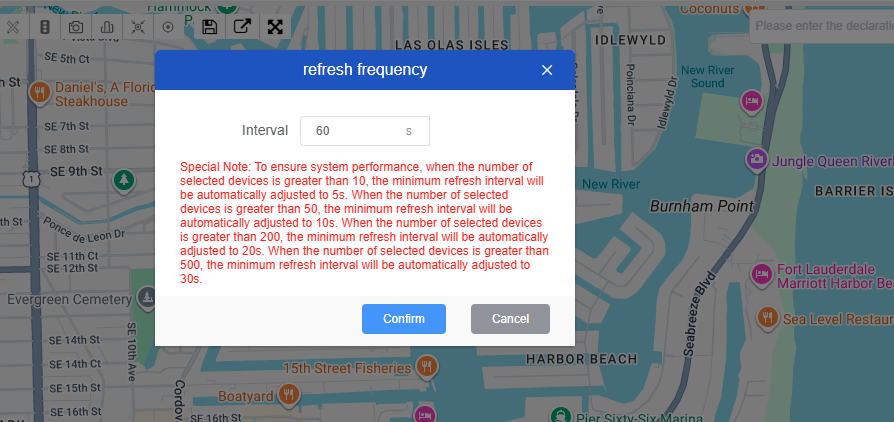
Real-time data export: 
All data in the list column will be exported to Excel, which can be exported according to the custom displayed fields.
Select Set custom display: 
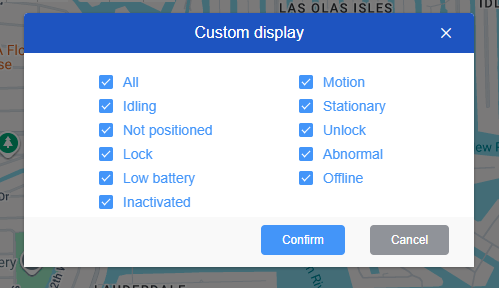
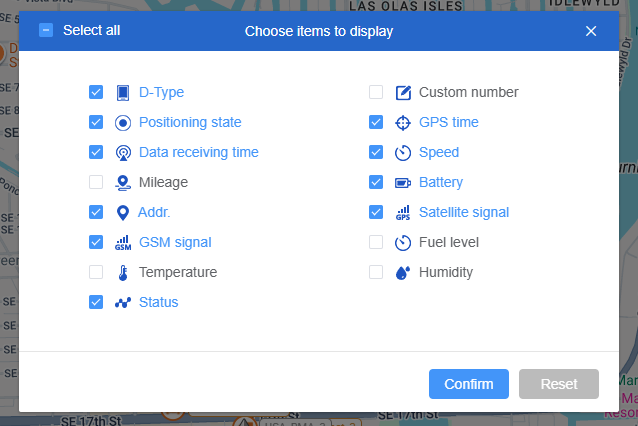
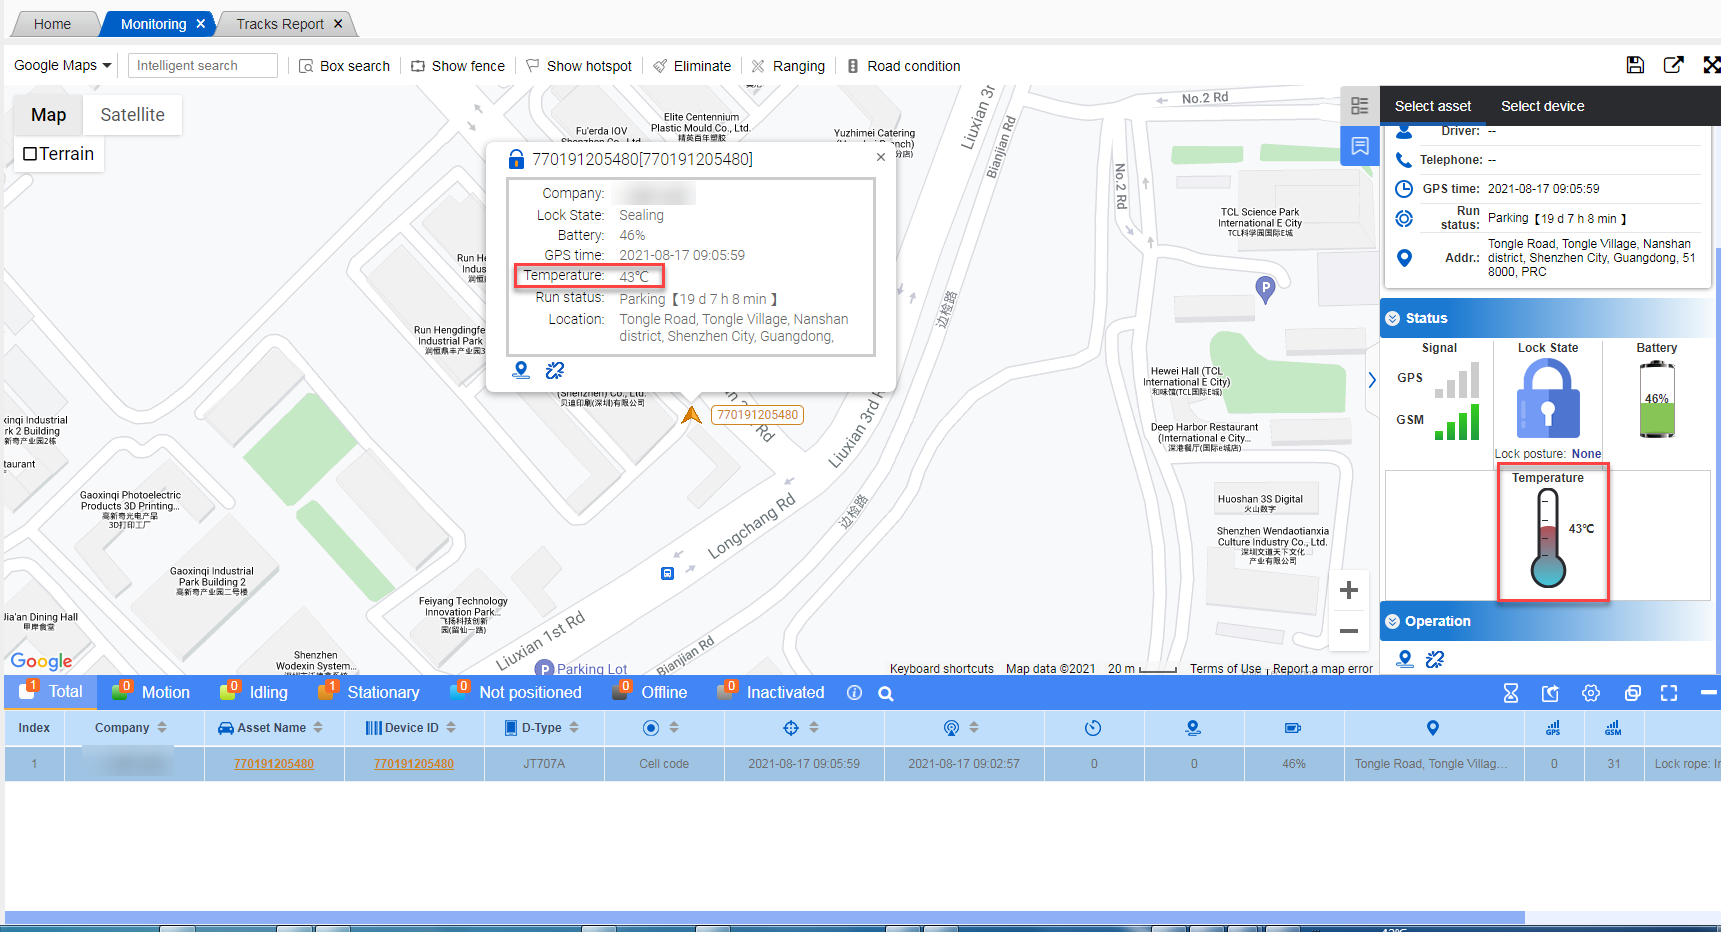
Added temperature status display data for device (JT707A):
Asset Sharing: After selecting the device, the asset information can be shared within the specified time through email or generated link.
